1. Getting Started
1.1 Account Requirements
DX Log 3.0 is located at:
https://dxing.fi/log/
To authenticate, you need an external account in:
- MWLIST for AM/SW logging
- FMLIST for FM logging
DX Log uses your existing MWLIST/FMLIST credentials. If you don't have an account, click Register to go to the MWLIST or FMLIST site — choose based on which environment (MWLIST or FMLIST) you intend to use.
If needed, register on MWLIST/FMLIST first.
1.2 Create a QTH in MWLIST/FMLIST
You must have at least one QTH defined in your MWLIST/FMLIST profile. DX Log reads QTHs automatically from your profile; you cannot create QTHs inside DX Log.
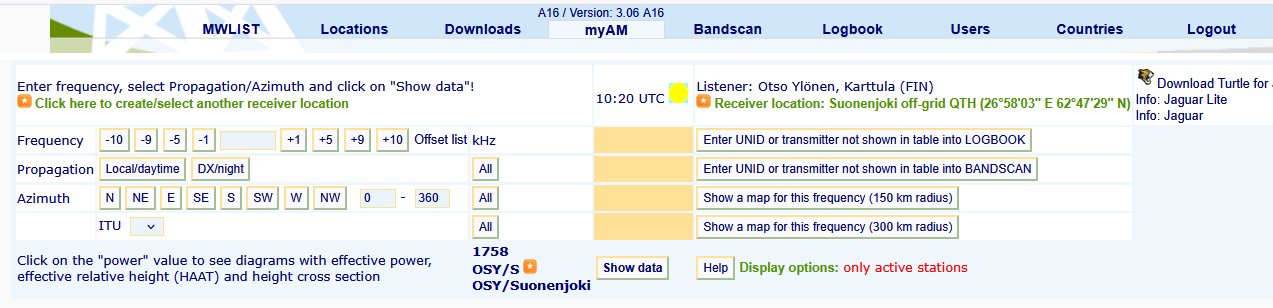
- Open myAM (or FM equivalent).
- Click "Click here to create/select another receiver location."
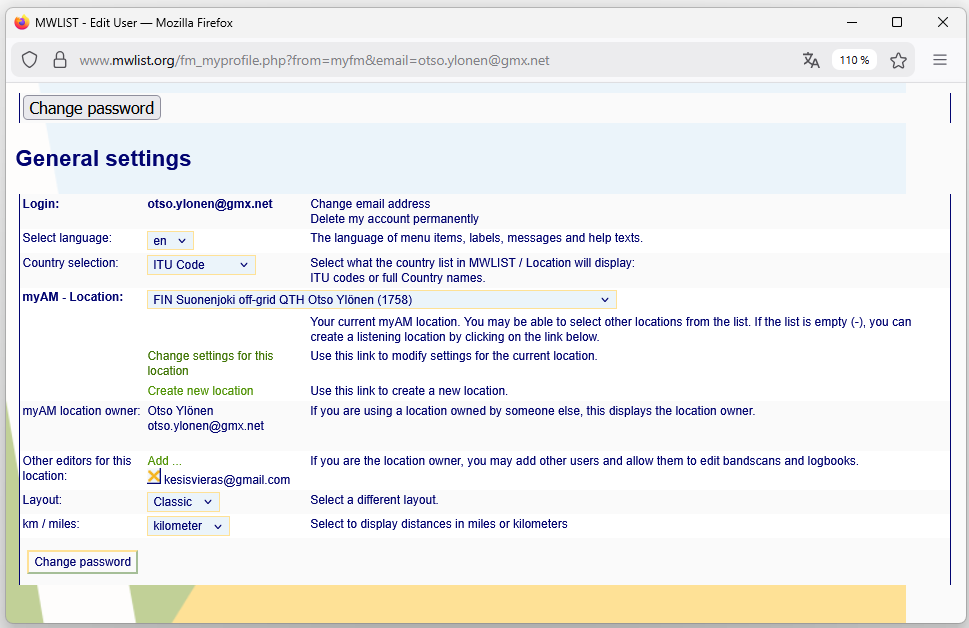
- Choose "Create new location."
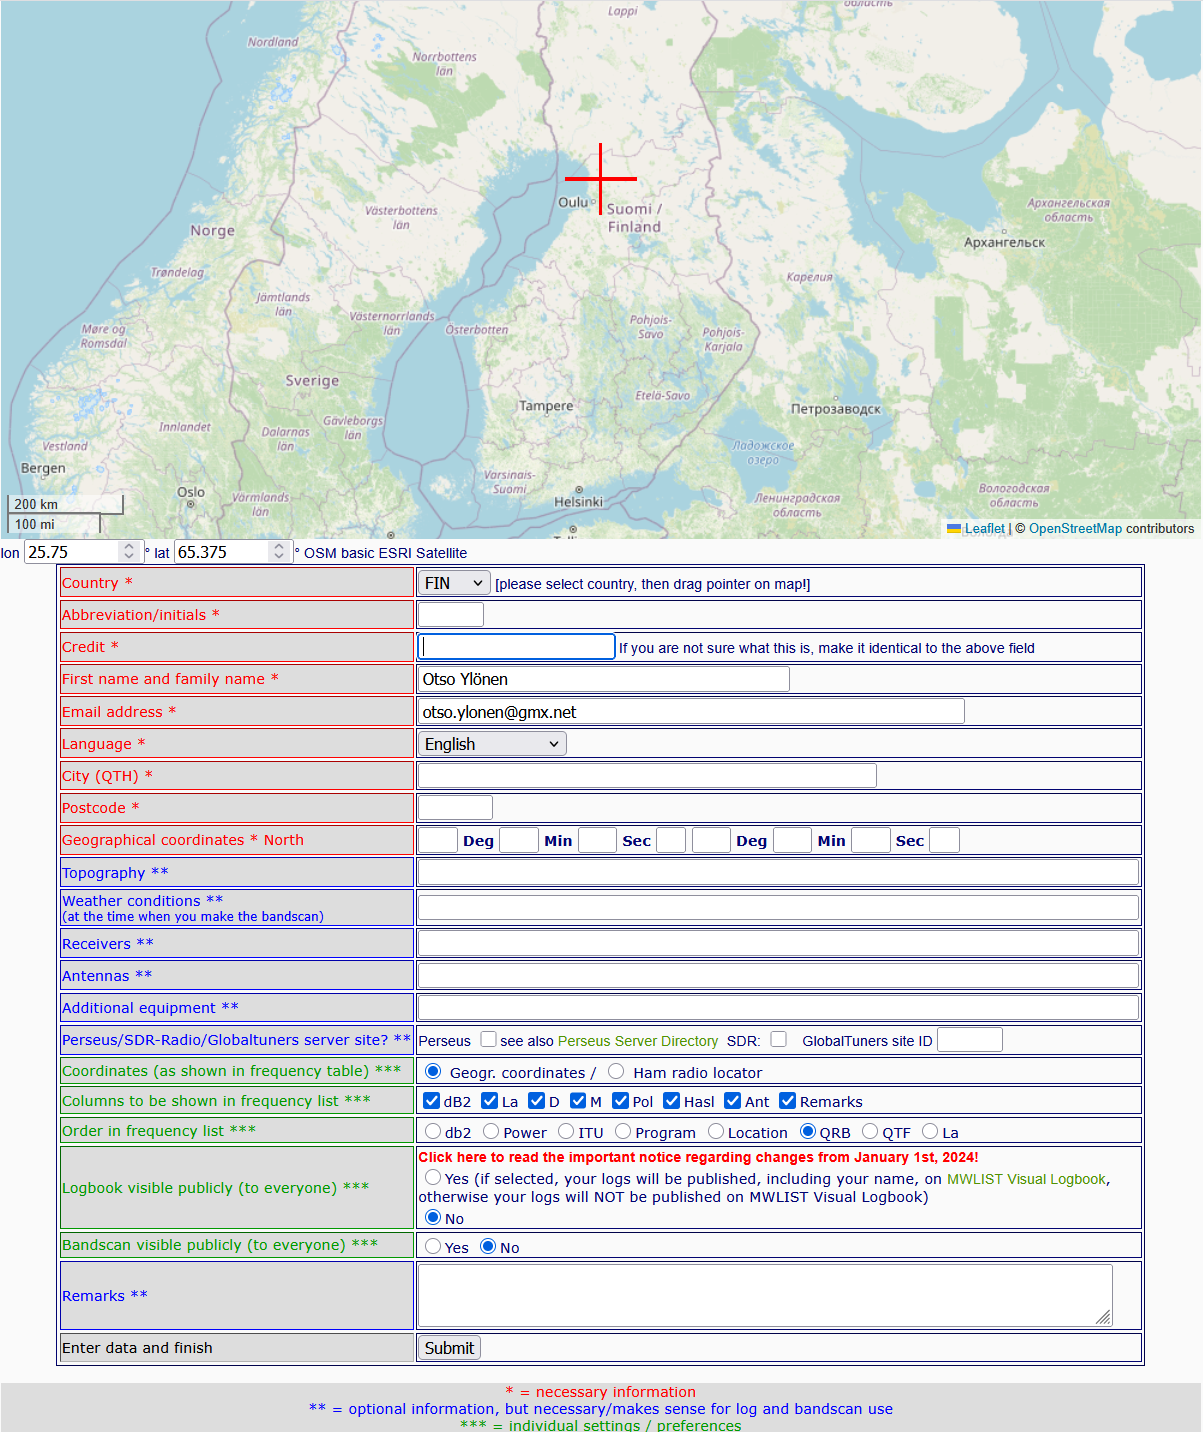
- Set country + precise map marker.
- Enter abbreviation (max 5) and credit label (max 20).
- Fill all required fields and submit.
1.3 What "Credit" Means
A credit (or Logger) is the person and QTH assigned to a specific log entry. Each log always has:
- One environment (MWLIST or FMLIST), and
- One credit (your QTH used for that reception)
You may create multiple Credits in MWLIST/FMLIST if you have multiple listening locations. Credits help you separate logs by site and keep propagation data (distance, bearing) correct.
1.4 Your First Visit
A bar appears at the bottom of the login page: "We save data to your device to improve your website experience. OK?" DX Log needs this. Everything the app remembers between visits lives in your browser, not on a server — see §11.5 for the full list. Declining takes you away from the app.
1.5 Select MWLIST or FMLIST
At login, select the correct environment based on the station type:
- MWLIST → AM/SW (long, medium & shortwave)
- FMLIST → FM
This choice determines the station database and search behavior.
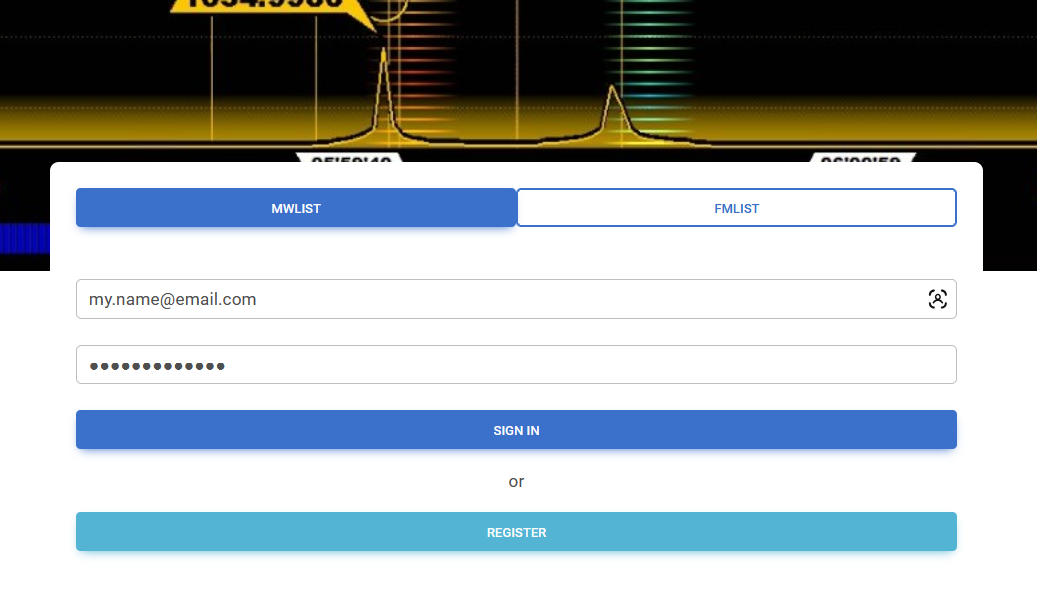
You can tell at a glance which one you are in: the navigation bar is blue for MWLIST and green for FMLIST, and the browser tab is titled accordingly. Several controls appear only in one of them — RDS PI/PS and Propagation are FMLIST-only, and Propagation is required when you save an FM logging.
1.6 How the Tabs Work
DX Log keeps one browser tab per page: Home, Log Station, Log Search and this User Guide. The buttons in the navigation bar do not navigate the page you are standing on — they reach the other tab, opening it only if it is not already there. Signing out closes them all again, leaving only Home (§1.8).
That is deliberate. A search page holds a form full of filters and a rendered result; a logging page can hold a half-typed entry. None of it is saved anywhere, so navigating away or reloading would throw it silently away.
- On desktop and Android the browser switches to the tab for you.
- On a phone the navigation buttons live behind the menu button (☰) — see §1.7.
- On iOS no page is allowed to bring another tab forward, so instead a short message tells you where the tab is (for example, "LOG SEARCH is open in another tab") and you switch to it yourself.
- If your browser blocks pop-ups, the guide cannot be opened for you and the button says so rather than navigating away from your work.
1.7 The Navigation Bar
| Control | What it does |
|---|---|
| Home | Back to the login/landing page. |
| Log Station | The page for finding a station and writing a new logging. |
| Log Search | The page for searching, analysing, editing and exporting loggings. |
| Settings | Date format and distance unit (§2). |
| Favorites ★ | Saved filter setups for the page you are on (§10). |
| Help ? | Opens this guide, jumping to the section for the page you came from. |
| About | Shows the date and time of your previous login — useful with the "Logs since" filter (§4.3). |
| Logout | Asks for confirmation, signs you out, and closes every tab the session opened — only Home is left (§1.8). |
On a phone: the menu button
Below about 576 px the bar has no room for eight controls, so it folds into a menu button (☰) at the top right. Tap it and the same controls appear as a list down the screen; tap it again to put the list away.
Choosing something from the list closes it. You do not have to dismiss the menu yourself, and you will not arrive at the next page — or come back to this one — with the panel still covering it.
| Tapping | The menu |
|---|---|
| Home, Log Station, Log Search, Help | closes, and you go to that page's tab |
| Settings, About, Logout | closes, and the dialog opens over the page |
| Favorites ★ | stays open — it opens its own list inside the menu |
| a favorite in that list | closes, and the setup is applied to the form behind it |
Favorites is the one control that does not close the menu, and for the obvious reason: it has just put a list inside it for you to choose from. The pencil and bin beside each favorite behave like the dialogs above — the menu closes and the rename or delete box opens.
1.8 Signing Out: Only Home Remains
When you press Logout, every tab the session opened closes. Only the Home page is left.
A session spreads across tabs as you work: you sign in on Home, Log Station opens in its own tab, then Log Search, then perhaps this guide. One press of Logout puts that back the way it started — a single Home tab showing the login form, ready for the next sign-in.
| Tab | At Logout |
|---|---|
| Home | Stays open, and returns to the login form. This is the tab you are left looking at. |
| Log Station | Closes. |
| Log Search | Closes. |
| This guide | Closes. |
It makes no difference which tab you press Logout in. That tab closes with the rest of them — you do not end up sitting on it, and you are not left with two Home pages. Logout is on Log Station and Log Search, so the tab you press it in is always one of the ones that goes.
The one exception: if you have no Home tab open, because you closed it during the session, then the tab you sign out from becomes the Home page instead of closing. Signing out never leaves you with nothing.
A tab you opened by hand — from a bookmark, or by typing the address — cannot be closed by the page inside it; browsers only allow that for tabs the site opened itself. This is also why it is Home that survives: you reached it by hand, so it is the one tab that cannot be tidied away, while the pages it opened for you can. A tab that cannot close clears itself instead and asks you to close it, so a signed-out search result is never left on screen either way.
2. Settings
SETTINGS has its own button in the navigation
bar of both working pages, Log Station and
Log Search. It holds two choices — the
date format and the distance unit —
and between them they decide how every date and every distance in
DX Log is written to you.
2.1 Date Format and Distance Unit
Before you start, it's recommended to choose the distance unit and
date format that best suit your preferences.
Click on the SETTINGS menu. By
default, dates use the ISO format (YYYY-MM-DD), and distances are
displayed in kilometers (km).
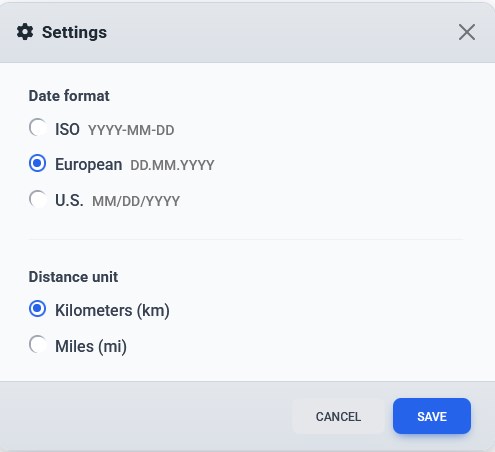
In the SETTINGS menu, choose:
-
Date format: ISO (
YYYY-MM-DD), EU (DD.MM.YYYY), or US (MM/DD/YYYY) - Distance unit: kilometers (km) or miles (mi)
Save puts both choices into effect.
Cancel, the ✕ and
Esc all close the box and change nothing. The box does not
lock the page behind it, so you can leave it open while you look at
what it has done.
It also opens showing what is actually in force rather than what this page loaded with. If you changed the unit in another DX Log tab, this one has already followed, and Settings shows you the new choice — not an old one inviting you to "fix" something that is already right.
2.2 Where Your Choice Applies
These preferences are applied consistently throughout the application, including:
- Searching for stations to log
- Searching for stations that have been logged
- The window for entering a new log entry
- The window for editing an existing log entry
- Popup information boxes on the world maps
- The filter pills under the continent buttons, and the same filters on the map's own header (§7.2)
- The Stats window, and the Excel and Word exports
2.3 The Two Distances That Stay in Kilometres
Two things stay in kilometres whatever you choose, because they are fixed landmarks rather than a scale that should follow a preference: the 20 000 km (12 427 mi) ceiling on the Distance filter, and the 9999 km (6213 mi) mark above which an FM distance is treated as a missing one. This guide gives both in both units wherever it names them.
The FMLIST distance rings do follow your choice, and they are the one place where it changes what is drawn rather than how it is written: a kilometre reader and a mile reader get different rings, not the same rings relabelled.
2.4 Where the Choice Is Kept
Both settings live in the browser you made them in, alongside everything else DX Log remembers (§11.5). They survive signing out and closing the browser, so they are set once rather than at every visit.
Because they are held per browser, they do not travel with your account: a different computer, a different browser or a private window starts again at ISO dates and kilometres until you set it there too. Clearing your browser's site data has the same effect.
3. Logging a Station
This is the Log Station page. You search the MWLIST/FMLIST station database for the transmitter you heard, then write a logging against it.
3.1 Select Credit (Your QTH)
Use the Logger/Credit dropdown to choose the QTH where this reception occurred. All logs created in this session will be assigned to the selected credit — ensure it's correct before logging to avoid later edits. Your choice is remembered separately for MWLIST and FMLIST.
3.2 Search for a Station
The quickest way to find candidates is by entering a frequency. You can tune in steps using:
- The +/− buttons beside the frequency field
- Keyboard Up/Down arrows
- Numpad + and −, or — with NumLock off — numpad 8 and 2
Stepping snaps to the channel grid rather than simply adding the step: from 1241 kHz with a 9 kHz step you land on 1242, not 1250. Stepping while the cursor is in another field still works — the arrows are captured for tuning.
Choosing the step
The step menu sits next to the frequency field, and your choice is remembered per band — an AM step and an FM step are stored separately, so switching environments does not lose either. If you have never chosen one, the default is 9 kHz on AM and 0.1 MHz on FM.
FM Frequency Steps
- 0.03 MHz – OIRT band
- 0.05 MHz – Italy
- 0.1 MHz – most regions globally
- 0.2 MHz – North America
- 1.0 MHz – fast scanning across the band
AM Frequency Steps
- 1 kHz – fine tuning
- 5 kHz – SW bands
- 9 kHz – MW in most of the world (outside the Americas)
- 10 kHz – MW in the Americas
Search Fields (enter at least one)
- Frequency (MHz/kHz)
- Country
- Program (station name/callsign/branding; wildcards are built-in on both sides)
- Location (wildcards are built-in on both sides)
- Region
- RDS PI and RDS PS (FM only)
You can combine fields (for example, Frequency + Country) to narrow results.
Start the search by pressing the SEARCH button or the Enter
key.
Partial station names are supported (for example, typing Radio
will match Radio X, Radio Nacional, etc.).
3.3 Narrowing the Candidates
Three range filters trim the candidate list after the database has answered. They are especially useful on a busy MW channel that returns several hundred transmitters:
- Distance (min/max, in your chosen unit) — how far from your QTH a transmitter may be.
- Bearing (start/end, in degrees) — the heading from your QTH. Useful for a directional antenna.
- Power (min/max, kW).
The status line beside the buttons always says what was removed and why, for example:
312 of 867 stations (hidden: 488 outside distance, 66 without a
              program name, 1 UNID).
3.4 The Funnel: Hiding Nameless Stations
A small funnel icon appears next to the hit count whenever the result contains entries with no program name (or a program name of literally "UNID"). Click it to hide them; click again to bring them back. It turns red while it is filtering, and the hit count updates to say how many it took out.
The funnel remembers its state between sessions. If a station you expected is missing from a candidate list, check whether the funnel is red.
3.5 Filtering the Candidate List
A busy frequency can return hundreds of candidates. The
filter box above the list narrows them to the ones
you care about — type poland and only Polish
candidates remain, radio -relay for the ones
carrying "radio" but not "relay".
It uses exactly the same four operators as the find box on the search page, so there is one syntax to learn for both: a space is and, a pipe is or, a leading minus is not, and quotes match the whole word. §5.6 has the full table and the worked examples.
-
It searches the row as displayed — the frequency,
country, station and regional name, location and region, the
distance in your own unit, bearing, power, any PI/PS, and
the remarks. So
812 kmworks if that is what the row says — and505 miif you have set miles, since the box searches the text on screen and not the kilometres behind it. -
It composes with the funnel: both can be on, and
the hit count names each of them separately —
(hidden: 66 without a program name, 412 not
                matching "poland")
. -
Enter applies it, Esc clears it, and the
×button does the same. - It survives a new search. Type the next frequency and the filter is still on, which is what you want when working down a bandscan — the status line always says when it is hiding something. CLEAR removes it and takes the box away with the rest of the result.
Your browser's own Ctrl+F still works normally on this page and is left alone, because every candidate row really is on the page here. Use it to step through matches; use the filter box to narrow the list. (On the search page Ctrl+F is taken over, because there the rows are not all in the page for it to find — see the note in §5.6.)
3.6 Results & Sorting
Your results appear as a list of matching stations.
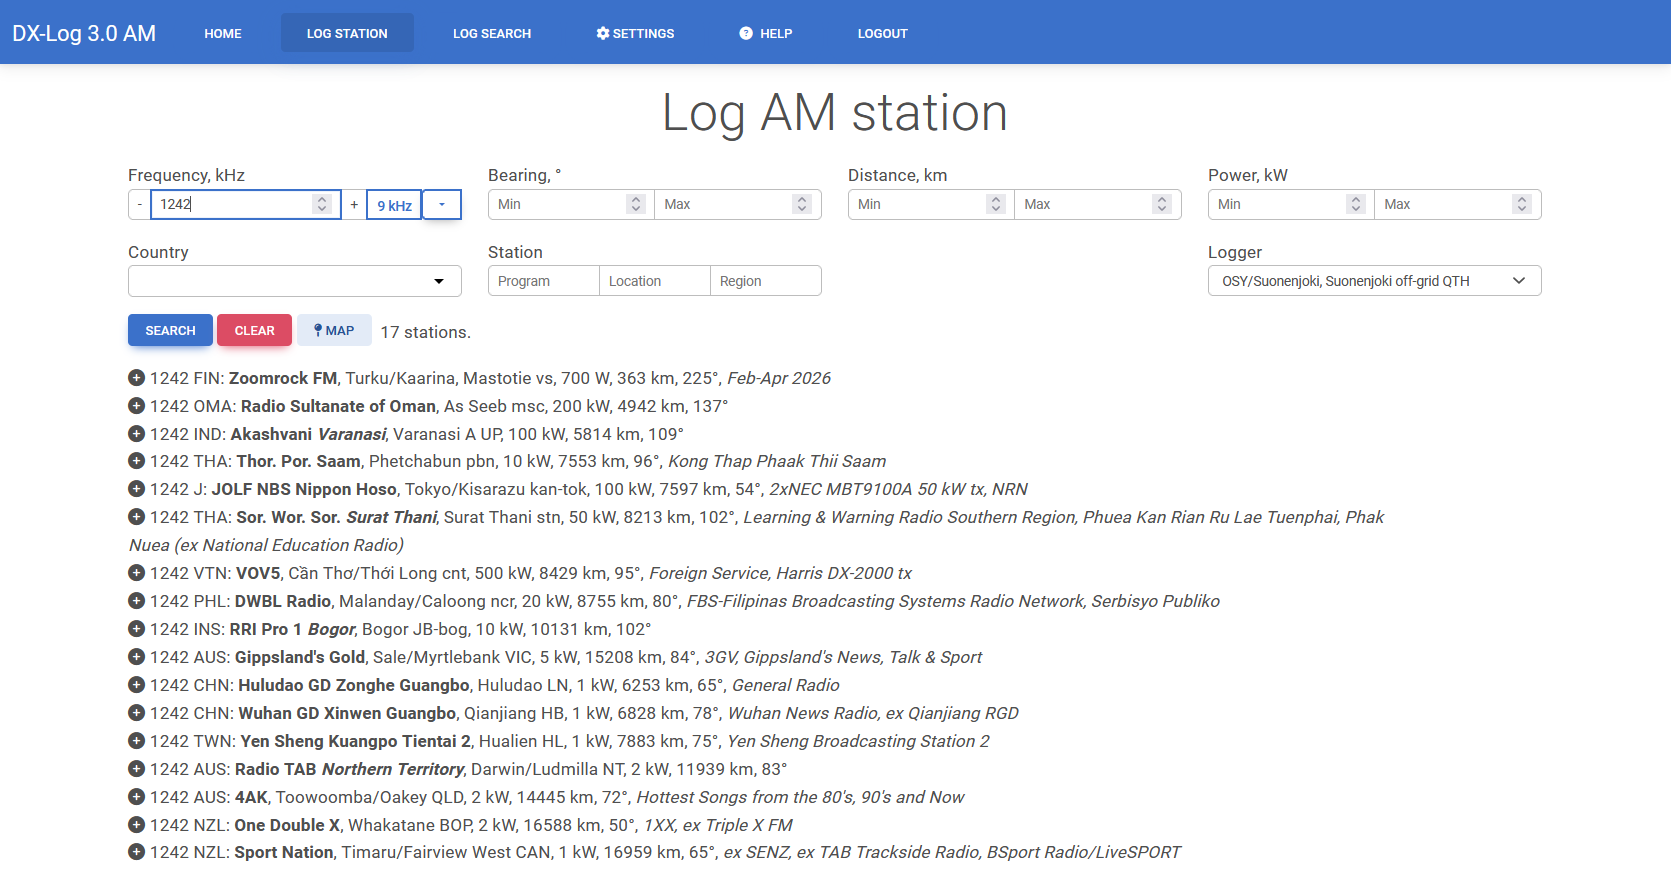
- If you specified a frequency: results are sorted nearest first; where two transmitters are the same distance away, the stronger one comes first.
- If you did not specify a frequency: results are listed in the order the database returns them, grouped by ITU country code.
Two kinds of unlikely candidate are pushed to the bottom of the list regardless of distance: anything under 0.1 kW, and anything of 3 kW or less further away than 6000 km (3728 mi). They are still there — they are simply not offered ahead of the plausible IDs.
3.7 What a Candidate Row Shows
Reading left to right, a row is:
| Part | Notes |
|---|---|
| ⊕ icon | Click it to open the New Logging window for this station. |
| Frequency, ITU code | kHz on AM, MHz to two decimals on FM. |
| Program regional program | The station name in bold; any regional/local programme follows in italics. |
| Location REGION | Transmitter site, then its region where the database has one. "Unknown" is shown as blank. |
| Power | Omitted when the database records no power, or zero. |
| Distance, bearing | From your selected QTH, in your chosen unit; bearing in degrees. |
| PI / Reg. PI, PS / Reg. PS | FM only. Shown as NoPI / NoPS when the database has none. |
| Remarks | The database's own notes on the transmitter, in italics. |
3.8 The Candidate Map
Click the MAP button to inspect transmitter
positions, distance, and bearing; open station popup links for
detailed transmitter site view.
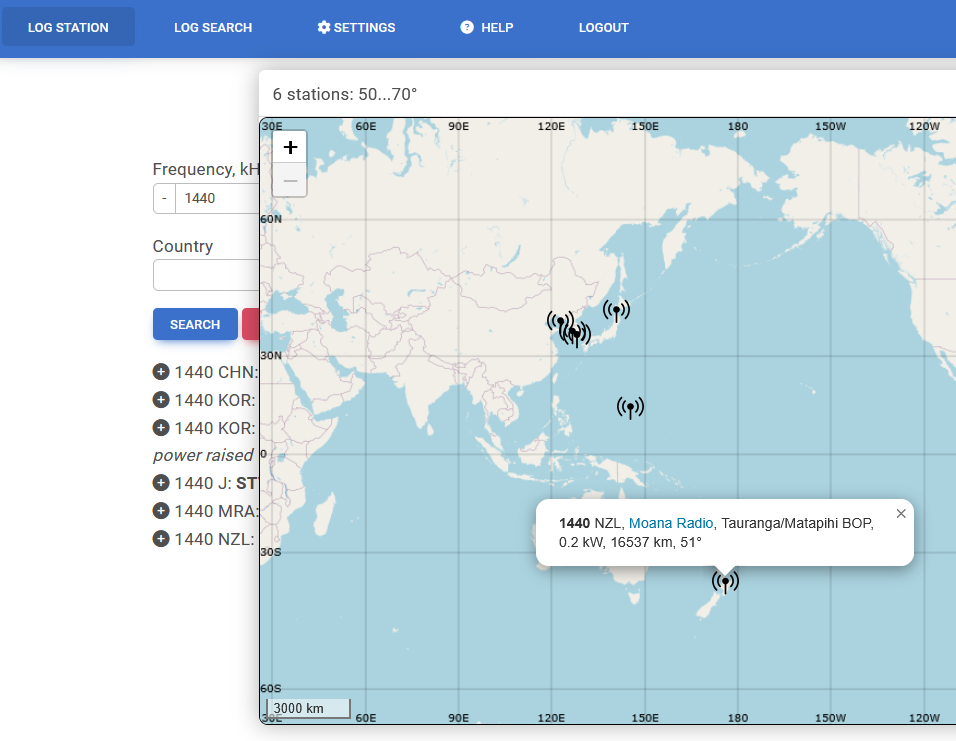
From the map:
- Click a transmitter icon to view station name, technical parameters, and distance & bearing from your QTH.
- Click the station name — where it is shown as a link, it opens Google Maps in a new tab, in satellite view and zoomed right in on the transmitter itself, so you can see the mast and its antenna layout. Invaluable for cross-verifying a site.
- Click the ⊕ in front of the frequency to log that station without leaving the map — see §3.9.
The station name is only a link when the database has coordinates for that transmitter. Without them there is nothing to centre a satellite view on, so the name is shown in bold instead — that is the same pop-up doing what it can, not a broken link.
A busy MW frequency can put several hundred transmitters on this map, so the pins are clustered: zoom in and the clusters break apart. Transmitters sharing one mast — common on MW — fan out when you click the cluster at full zoom, rather than hiding behind one another. If you have set a bearing range, two lines are drawn from your QTH along its edges. See §7 for the rest of the map's behaviour.
3.9 Create & Submit the Log
When you've identified the correct station:
- Click the ⊕ button in front of the station. There are two places you can do this — see below.
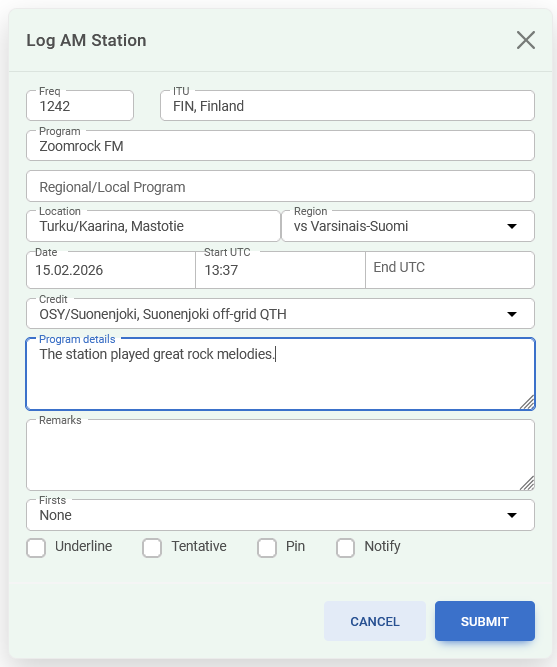
- A New Logging window opens with station and technical fields pre-filled.
-
Fill in reception details:
- Date and Time (uses your selected date format; use UTC consistently)
- Program details (ID phrases, language, content type, songs, ads, newscasts, etc.), up to 200 bytes.
- Remarks (signal quality, interference, fading, antenna used, mode, RDS details, etc.), up to 200 bytes.
Two ways in: the list, and the map
The ⊕ in front of a row in the result list is the obvious one. The same control also sits in front of the frequency in every map pop-up, so a station you spotted on the map can be logged where you found it instead of being hunted for again in the list behind the panel.
- Click a transmitter on the map, then click the ⊕ at the start of the pop-up. The New Logging window opens exactly as it does from the list.
- The map stays open behind the window. Close the window and the marker you just clicked is still there, ready for the next one — which is what makes working straight down a busy channel from the map practical.
- Where several transmitters share one mast, the pop-up lists them all and each gets its own ⊕, so you can log the right one without zooming further in.
A station the database holds no id for gets no ⊕ in its pop-up; log
it from the list, or use Log UNID (§3.13).
What is filled in for you
- Start UTC is set to the current time when the window opens.
- Date repeats the date of your previous logging in this browser session, so a night's work does not mean retyping the date each time. It falls back to today's date at the start of a new session, and if the date it is about to repeat is not today's, it asks first — see below.
- Credit and, on FM, Propagation remember your last choice.
When the date is not today's
A repeating date can go on repeating one you have stopped meaning: after a break, or once 00 UTC has passed during a long session. So when the date about to be carried over is not today's UTC date, a small Date check window opens before the log window, with both dates on its buttons:
-
Use 25.08.2026— today's date, and it stays today's from then on. -
Keep 24.08.2026— go on with the date you were using.
Esc, Cancel and the ✕ all keep the old date, so dismissing the window never re-dates a logging behind your back. Either way you are not asked about that date again until the next UTC day: an evening of back-dated loggings is interrupted once, not once per station.
Required fields
Credit, Date and Start UTC must be filled in — and on FMLIST, Propagation as well. A missing one is outlined in orange and the save does not proceed; the outline clears as soon as you touch the field.
The 200-byte counters
Program details and Remarks are limited to 200 bytes, not characters, and the label counts down as you type. Plain ASCII costs one byte per character, but accented letters (ä, ö, é), Cyrillic, Greek and emoji cost two or more. A paste that is too long is trimmed to fit, never mid-character. A pasted paragraph arrives as a single line: tabs and line breaks become spaces.
3.10 Read-Only Fields and Their Unlock Toggles
Several fields open in a greyed, read-only "FYI" state: Regional/Local Program, and — on FM — RDS PI, RDS PS, Regional RDS PI and Regional RDS PS. They show you what the database holds so you can compare it against what you actually heard.
Each has a small toggle beside it:
- Toggle on — the field becomes editable and is marked as accepted: you are asserting this value for your logging. The cursor jumps into it.
- Toggle off — the field locks again and reverts to the database's original value. Anything you typed there is discarded.
A field left locked is never treated as something you edited, so it cannot arm Notify (below) by accident.
3.11 The Notify Checkbox
Notify tells the MWLIST/FMLIST database editors that this logging carries information differing from the database. It checks itself the moment you change any of:
- Frequency
- Program (station name)
- Regional/Local Program — only if you have unlocked it
- Location
- RDS PI
It also un-checks itself if you put the original value back, so an accidental keystroke you corrected does not send an editor a report about nothing. You can always tick or untick it yourself.
3.12 First, Underline, Tentative, Pin
- Set First status (Personal / Country / Continent / World) when applicable.
- Use Underline to highlight notable logs for future searches and reports.
- Mark Tentative if identification is not fully confirmed (uncertain ID).
- Pin marks a logging you want to come back to. Pinned logs can be searched for on their own (§4.6).
Each of these shows up as a marker in the result list — see the legend in §5.2.
3.13 Logging an Unidentified Station
Press Log UNID to open an empty logging window
with no station attached. Use it for a carrier or a programme you
heard but cannot tie to any database entry — a frequency, a time, and
whatever you can describe. Fill in the frequency and whatever else you
know; the required fields are the same as for any other logging.
3.14 Submitting
Click SUBMIT to send your log to the
MWLIST/FMLIST database.
Note: You will only be prompted if the log write
did not succeed.
4. Searching Your Logs
DX Log is a global log database with contributions from hundreds of users. Use filters to focus by geography, time, station properties, or technical constraints.
If you press SEARCH with no filters, you will
see your own logs from the last 12 months by default — all
of them, under every credit (logger name) you hold, not just the one you
are currently logging with. To reach other people's loggings you set a
Logger Country; see §4.5.
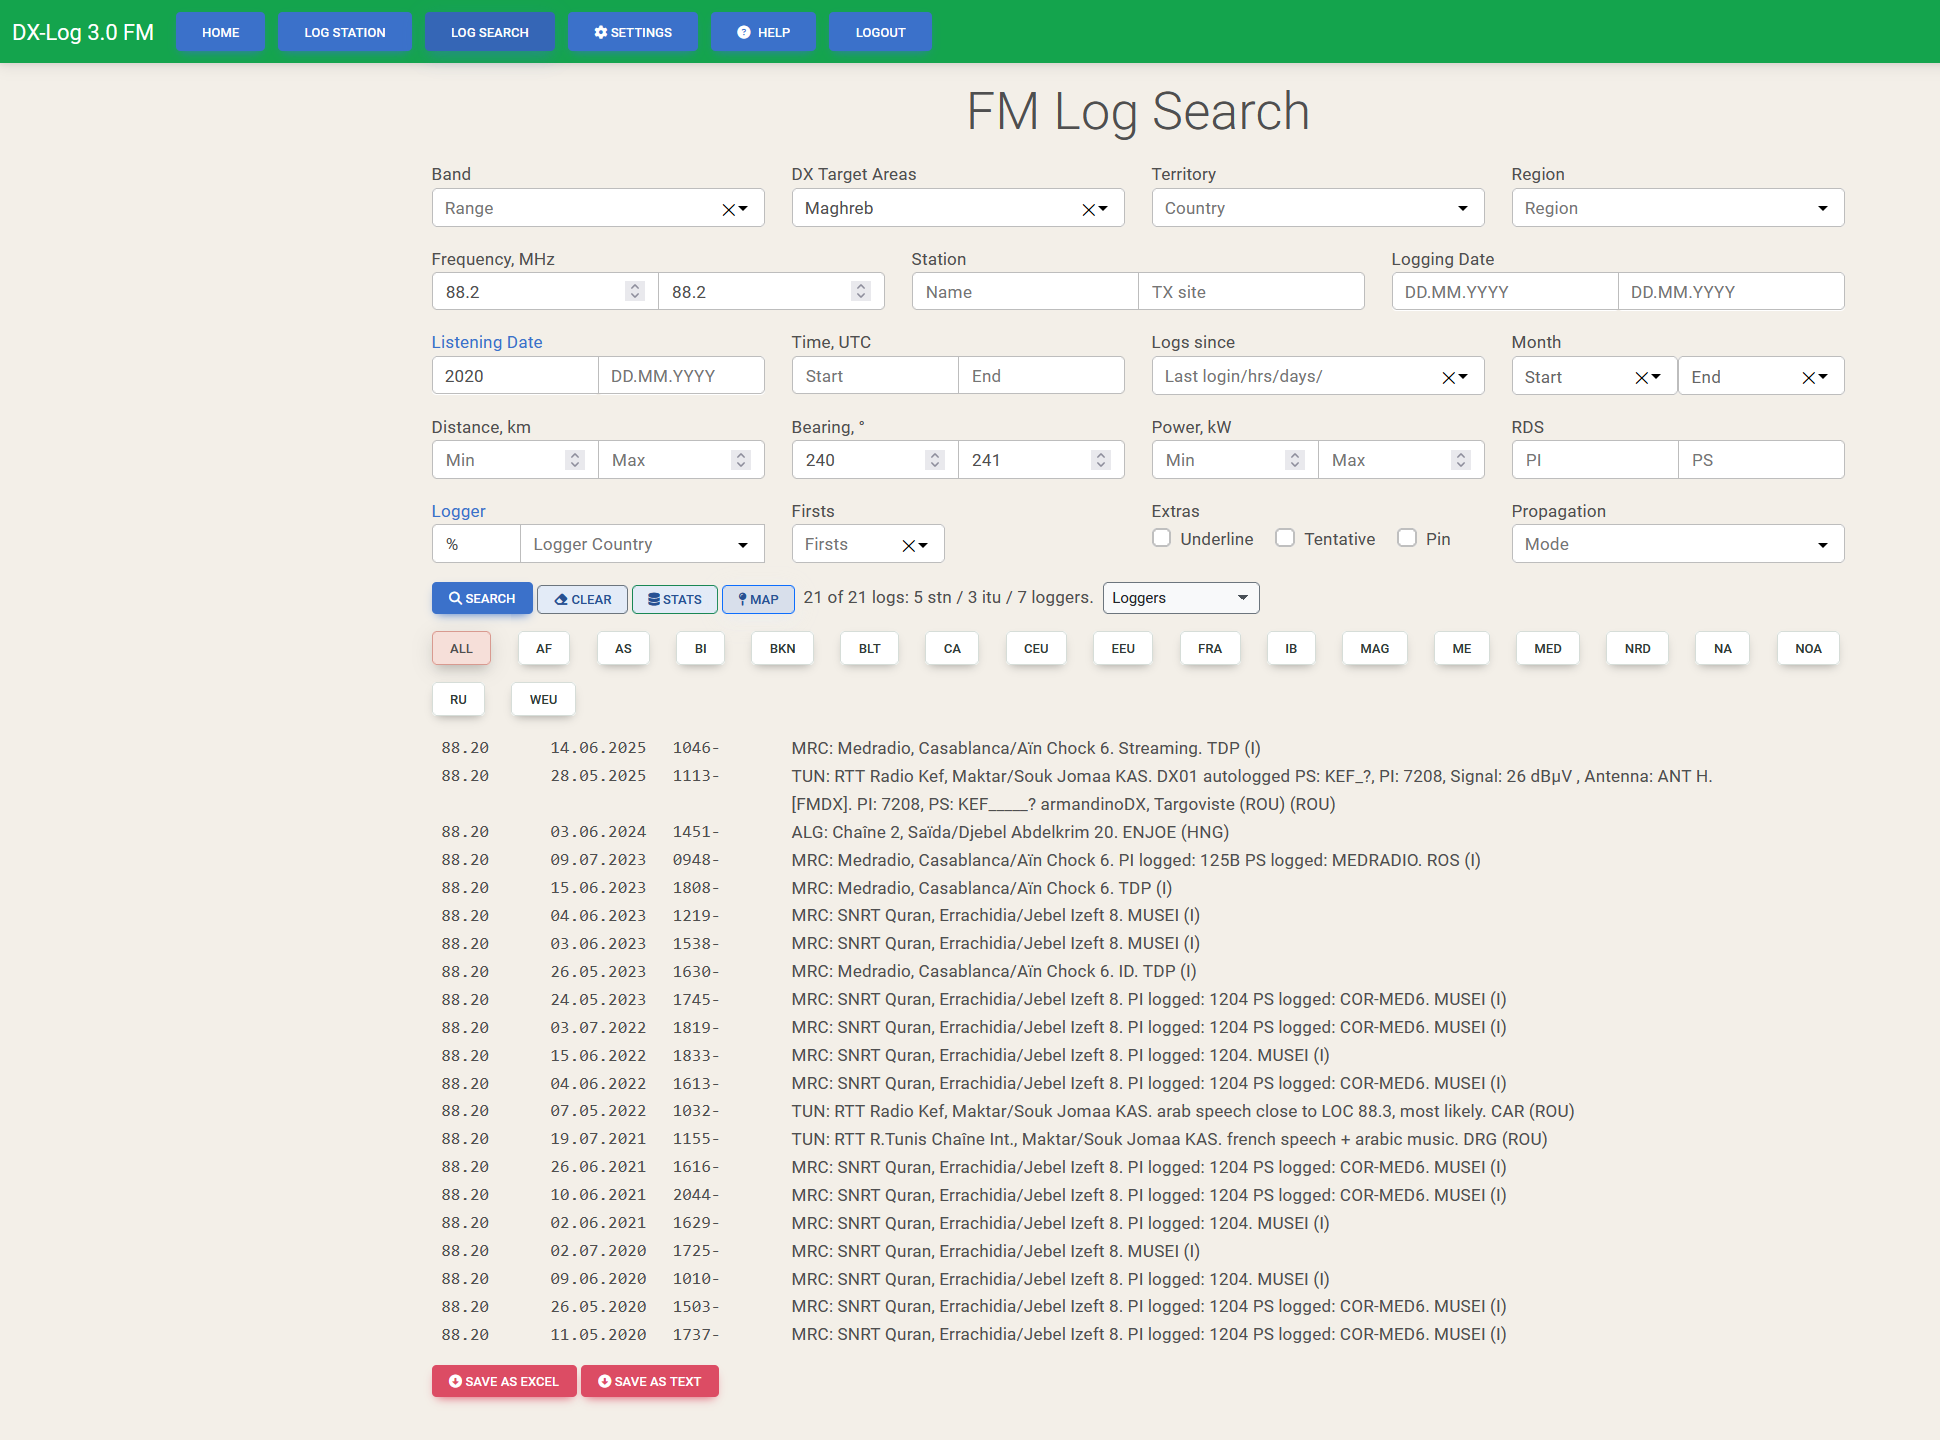
4.1 Station Properties
- Band — a named band (LW, MW, SW and the metre bands on AM; CCIR, OIRT, Japan, China Low and the TV bands on FM). See §11.2 for the exact ranges.
- Frequency — a Min/Max range in kHz (AM) or MHz (FM).
- DX target area (continent or regional group)
- Territory (country, by ITU code; several at once)
- Region (state/province level, when available)
-
Station name and TX site — both
are matched as "contains", anywhere in the field. Typing
nacionalfinds Radio Nacional and RNE Nacional alike.
- Choosing a Band clears the frequency Min/Max, and typing a frequency clears the Band. Only one of them can be deciding the range, so only one of them is ever set.
- Opening DX target area clears Territory, and opening Territory clears DX target area. Pick a whole area, or pick countries — not both.
Region is fetched from the server for the Territory you picked, so choose the country first and the region list second. Changing the country empties it and loads the new one. It is meant for a single country at a time.
4.2 Date Filters
- Listening date (start/end) — when the reception happened. This is the one most searches want.
- Logging date (start/end) — when the entry was written into the database.
- Time, UTC (start/end) — narrows to a window of the day, applied to every date in the range.
- Month (start/end) — a season rather than a date range. It wraps: setting November to February gives you one DX season across the turn of the year, not an empty result.
- If no listening date is defined, the last 12 months are shown.
4.3 "Logs since" — What Is New
The Logs since menu answers a different question from the date boxes: what has been added since I last looked? It filters on the logging date — when an entry was written — and it overrides the Logging Date range while it is set.
- Current login — everything written since you signed in just now.
- Last login — everything written since your previous session. The About box shows that timestamp.
- 15 min / 30 min / 1, 2, 3, 6, 12 hr ago
- 1, 2, 3, 7, 14, 30, 60, 90 days ago
Combine it with a Logger Country to watch what a whole country has been posting during an opening.
4.4 Technical Filters
- Distance (km/mi) — focus results by proximity to your chosen QTH. You type in whichever unit you have set in Settings, and DX Log converts it to kilometres before searching. Entering only a minimum implies a maximum of 20 000 km (12 427 mi) — far enough round the world to mean "no upper limit".
- Bearing (degrees, 0–360) — useful for directional antenna logs.
- Transmitter power (kW) — entering only a minimum implies a maximum of 5000 kW, and vice versa.
A value outside the permitted range, or a minimum larger than its maximum, turns both boxes red. A value that is not a number at all is simply cleared when you leave the field. Frequencies are checked against the environment: 0–30 000 kHz on MWLIST, 30.01–806 MHz on FMLIST.
4.5 Logger Filters
Leave this row alone and you search your own logs — all of your credits at once, whichever QTHs you log from. That is the default, and it is what Enter gives you.
Once the result is on screen, the Loggers menu beside the continent bar (§5.5) lists every credit that actually appears in it and narrows the list to one. On a default search those are all your own credit names, so it is the quick way to see one QTH at a time without running a new search.
-
Credit (logger/QTH) — filter by a specific credit.
It takes one credit, not a list.
-
A
*or a%stands for "and the rest", and the two mean exactly the same thing — use whichever you reach for.OSY*finds every credit starting OSY,*OSYevery credit ending in it, andO*Yevery credit that starts O and ends Y. -
One wildcard per search. The database cannot do
two, so
*OSY*is refused rather than quietly searched for something narrower. The status line saysSearch not sent - the Credit field takes one wildcard, not 2.and whatever was already on screen stays there. -
Case does not matter:
osy*andOSY*are the same search.
-
A
-
Logger country / continent — this is what widens the
search beyond your own logs.
- Important — what "your own logs" means here. Leave the logger country and continent empty and the search returns your loggings and nobody else's — but all of them, filed under every credit you hold. If you log as OSY from one QTH and JKP from another, an empty logger row gives you both, in one list. It does not mean "the credit I am logging with today", and there is nothing you need to set to include the others.
- Select their Logger Country (or countries) and run the search. That opens the search out to everyone logging from there.
- Tick the people you want in the Loggers menu beside the continent bar (§5.5). It lists everyone the search found, and it takes as many as you like.
jkp | osy | hol — and is the better tool
when you want to match something other than a name.
4.6 Special Filters
- Firsts (Personal / Country / Continent / World)
- Underline (only logs you highlighted)
- Tentative (stations not fully identified)
- Pin — the pin checkbox is remembered between sessions. If a search comes back far smaller than expected, check whether Pin is still ticked from last time.
- Propagation (FMLIST only) — Es, Tropo, Meteor Scatter, Aurora, AuroraEs, F2, FAI, TEP; several at once.
- RDS PI / PS (FMLIST only).
4.7 Double-Click to Copy a Range
Every Min/Max pair on this page has the same shortcut: double-click the second box to copy the first one into it. That turns a range into an exact-value search in one gesture — one frequency, one day, one minute, one bearing.
| Double-click this | and it copies |
|---|---|
| Frequency Max | Frequency Min |
| Distance Max | Distance Min |
| Power Max | Power Min |
| Bearing End | Bearing Start |
| Listening Date End | Listening Date Start |
| Logging Date End | Logging Date Start |
| Time UTC End | Time UTC Start |
| End UTC in the edit window | Start UTC |
4.8 Running the Search
Start a search with SEARCH or
Enter.
CLEAR takes the page back to how it started. It
empties every filter and the result list, and with them everything
that was describing that result:
- the summary line above the list;
- the continent bar, the Loggers menu and the export buttons, which have nothing left to act on;
- the in-page find — both the term and the box itself (§5.6);
- the map. If the panel is open it stays open and goes blank, markers and title line together, rather than showing a search you have just cleared.
Only the map panel's own × closes it;
CLEAR empties it but leaves it where you put it.
Combine filters to build precise result sets (for example:
Country=FIN + Logging Date Start=2025 + Pin=checked).
Enter means "search" almost everywhere on the page — but not inside the in-page find box (where it means "filter what I already have"), not on a button, and not while a dialog is open.
4.9 While the Search Runs
A wide search is genuinely slow, and the status line says which part of it you are waiting on rather than showing an unchanging spinner. If the server has not answered at all, the wording escalates: "Waiting for the server…" after four seconds, "Still waiting…" after fifteen, "Still no answer…" after forty-five. None of these means anything is wrong; a wide date range simply takes that long.
Behind the scenes a large search is split into date windows and fetched a few at a time, then reassembled in order. That is why the line can move from waiting, to receiving, to drawing rows.
4.10 Very Large Searches
There is a ceiling — 250 000 loggings — and some searches reach it. When they do, DX Log does something specific that is worth understanding:
Too many loggings — showing 2026-01-01 to 2026-03-14
              complete (147,109 of about 233,330). Please narrow the search.
A result with gaps in it would look finished and quietly not be: the station, country and logger counts would be computed over a set full of holes. Trimming is what makes the totals mean something.
The other messages you may see, and what each one means:
| Message | Meaning |
|---|---|
| Received all N loggings. | Everything that matched arrived. The normal case. |
| … M could not be read and were skipped. | A few records came back damaged and were dropped. The rest is complete and usable. |
| Received N loggings, complete to <date>; K periods could not be read. | Parts of the range failed. Everything up to that date is whole. |
| Too many loggings to retrieve. Please narrow the search. | Not even the first day could be completed. Narrow the range or add a filter. |
| Showing the N loggings received before your session expired. | What arrived is real and is kept on screen, but it is not the whole result. Sign in again before relying on it. |
| No loggings matched your search. | The search worked; nothing matched. |
| Too many requests. Please wait a moment and try again. | You have searched very frequently. Pause briefly and retry. |
| The search service could not be reached / The server had a problem… | A server-side failure. Worth retrying; if it persists, it is not something your filters can fix. |
| Your session has expired. | Shown as an alert as well as in the status line. Log in again. |
5. Reading the Results

5.1 The Summary Line
Above the list, next to the buttons:
9,837 of 9,837 logs: 2,104 stn / 87 itu / 41 loggers.
- The first number is what is on screen — after the continent bar, the Loggers menu, the in-page find and any Stats filters.
- The second is what the search matched in total. When the two differ, either something is narrowing the view or the search was too large to fetch whole (§4.10).
- stn / itu / loggers are distinct stations, distinct ITU countries and distinct loggers in what you are looking at.
- If the in-page find is active, the line ends with Matching your term.
5.2 The Row Legend
A result row is dense on purpose. Left to right it carries the frequency, the date in your chosen format, and the start–end UTC times; then the country code, the station, its location, your comment, and the logger.
Everything else is carried by markers and typography:
| You see | It means |
|---|---|
| ✔ | Personal first — your first logging of this station. |
| + | Country first. |
| # | Continent first. |
| 🌐 | World first. |
| blue text | Goes with any of the four markers above: a first logging is coloured as well as marked. |
| 📍 | Pinned — at the end of the row. |
| Tentative: | The identification was not certain. The station name is italicised and prefixed. |
| underlined | Underline — a logging you marked as notable. On AM the location is underlined with the name. |
| bold | An underlined logging that is not tentative. |
| red row | A duplicate — see §5.3. |
| ✏ | A pen at the end of the row: this logging is yours and you may edit it (§8). |
| UNID | In the country column: the logging has no ITU country recorded. |
| N/A | In the frequency column: no frequency was recorded. |
Frequencies are right-aligned in a monospace column so they line up: whole kHz on AM (with one decimal when there is one), two decimals on FM. On FM, any RDS PI and PS on the logging are appended to your comment.
5.3 Duplicates — the Red Rows
A row is drawn in red when an earlier row in the same result has the same logger, the same station, the same frequency and the same date. The first occurrence stays normal; every later one is flagged.
It is a reading aid, not an error. Logging one station twice in a day — a morning check and an evening one — is perfectly legitimate, and the red simply tells you the pair is there. Rows with no station id (unidentified stations) are never flagged, because two unidentified stations on one frequency are not the same station.
5.4 The Continent Bar
A row of buttons above the list narrows it by area, instantly and
without asking the server again. Only the areas your result
actually contains get a button, so a button can never bring
back an empty page. ALL returns everything.
The two environments group the world differently. MWLIST uses broad continents plus a few DX-relevant splits; FMLIST uses much finer regional groups, because that is how FM DX is discussed. Both lists are in §11.4.
5.5 The Loggers Menu
Beside the continent bar, a menu lists every logger in the current result. On a default search — nothing set in the Logger row (§4.5) — those are all your own credits; on a search by Logger Country they are the people it found.
You can pick more than one. Tick two or three names and
the list shows those people's loggings together, which is the quick way
to compare what a few stations heard in the same opening. The trigger
names the one you picked, or counts them —
3 loggers — when there are several, and the
× clears the lot.
The menu always offers everyone the search found, whether or not they are currently ticked, so you can add and remove people freely without starting again. It follows the continent bar, though: choose Europe and the menu lists the loggers with European loggings.
It also changes what the map can tell you: distance and bearing are only meaningful against a single receiver position, so map popups carry them — and the FMLIST distance rings appear (§7.4) — only while exactly one logger is picked. With several, the map plots them all and its title line counts them.
If the result contains just one logger, they are picked automatically, so the map has its single receiver without your having to ask. You can also pick one from the map: clicking a red receiver pin opens a popup whose name is a link to that logger's loggings, and a transmitter's popup lists everyone who heard it, each name a link of the same kind (§7.3).
5.6 The In-Page Find
The find box appears just above the list once a search has returned rows, and goes again when you press CLEAR. It filters the rows you already have — no new search is sent — and it is genuinely a filter, not a step-to-next-match:
It looks anywhere in the row — frequency, date, station, location,
comment, logger — and it matches part of a word, so
radi finds Radio. Case does not matter.
The four operators
| Type | Means | Example |
|---|---|---|
| a space | and — both must appear, in any order | fun radio |
| | | or — either will do | jkp | osy |
| - | not — drop rows containing it | -hol |
| " " | whole word — the word on its own, not inside a longer one | "hol" |
They mix freely, and "or" binds tightest. There is nothing to bracket: a space always means "and", so everything between two spaces is one condition.
Worked examples
| You type | You get |
|---|---|
fun radio 87.6 |
Rows carrying all three, in any order and not necessarily next to each other. |
jkp | osy |
Rows carrying either logger name. Spaces around the
pipe are optional — jkp|osy is the same
thing — and you can chain as many as you like:
jkp | osy | hol. |
radio kanal -osy |
radio and kanal, but not osy. |
jkp | osy -hol |
(jkp or osy) and not hol. |
jkp|osy 87.6|90.1 |
Either of those two loggers, on either of those two frequencies. |
-hol|kanal |
Everything except rows carrying hol or kanal. A pipe works on an exclusion too. |
2026-07-23 |
That date. A minus inside a word is ordinary text —
only a leading minus excludes, which is why dates,
1149- and co-located
all search normally. |
-"hol" |
Drops the logger HOL and leaves Stockholm alone — see the box below. |
"fun radio" |
That exact phrase, in that order. Quotes around several words search for the phrase rather than the words separately. |
-hol does not only drop the logger HOL — it also
drops every row mentioning Stockholm, Holland or
Holmestrand. If a find removes more than you expected, this is
almost always why. Put the word in quotes —
-"hol" — and only the word itself counts.
There is no setting to remember: without quotes you are matching part of a word, with them the whole word, and you can see which you asked for in the box and in the Matching … note above the list. The two mix freely, so
radio -"hol" is part-word
for what you are hunting and whole-word for what you are dropping.
Spaces just inside the quotes are ignored, so
" hol " and "hol" are the
same search — and a space after the minus makes no difference either,
so radio - hol excludes just as
radio -hol does.
Other things worth knowing
-
It matches the row as displayed. Search for the date
the way you can see it —
21.06.2026— and it works, whatever format is underneath. - Enter runs it, Esc clears it, Ctrl+F jumps to the box, scrolls to the top and selects what is there so your next keystroke replaces it.
- The find composes with everything else — the continent bar, the Credit menu, the Stats filters — and the map and the exports follow it.
5.7 Which Software Filed a Logging
Not every logging is typed in by hand. Several logging programs file straight into the database, and each one stamps its own name into the Remarks as it does so. DX Log shortens that stamp to a four-letter code in square brackets and shows it with your comment in the result row, so a long marker does not eat the width of the column.
| What the program writes | In a result row | In the Excel export |
|---|---|---|
via Jaguar (direct) | [JAGR] | Jaguar |
via API5 | [API5] | API5 |
via CSVUserlistBrowser | [CSVU] | CSVUserlistBrowser |
via StationList (direct) | [STNL] | StationList |
via fmdx.org webserver | [FMDX] | fmdx.org |
RDS LogBook log (direct) | [RDSL] | RDS LogBook |
via WavViewDX | [WVDX] | WavViewDX |
Logger by Ced | [CEDL] | Logger by Ced |
xdrserver | [XDRS] | xdrserver |
There is nothing to set: the code is simply what the program wrote. A logging you typed in yourself carries no code, and its Software cell in the Excel export (§9.1) is empty.
The codes are searchable. Type [JAGR] into the
find box (§5.6) to keep only the loggings Jaguar filed. For picking
apart a large result by program, though, the Excel export is the better
tool — it names the software in a column of its own, with a filter
already on it.
6. The Stats Window
Press STATS on the search page to open a window that
summarises the loggings you are currently looking at, in four tabs:
Logs by day, Logs by area,
Time & direction and Top lists.
Search more than a year and Logs by day holds a second chart, the
twelve-month consolidation described in §6.5 — the one that answers what
time of year rather than when.
It is not only a summary. Almost every bar, cell and row in this window is also a filter, so the window doubles as a way of cutting a large result down to the loggings you actually want to read — and anything you can reach that way can also be put on the map.
The window can be dragged by its header if it covers something you want to see.
Close it with the ×, with Esc,
or by clicking outside it.
6.1 What the numbers count
Everything in the window is counted over the rows the page is showing right now — not the whole database, and not necessarily your whole search. That means the figures already reflect:
- the continent buttons above the result list,
- the Credit (logger) menu,
- the in-page find box, and
- any Stats filters you have already set.
The line at the top of the window says so explicitly. It names the scope first, then the totals:
EU (KALMA, FIN, 05.10.2025): 1,204 logs · 251 stations
              · 12 loggers · 9 countries · 01.10.2025 – 20.03.2026 ·
              furthest 2,480 km
-
The word in front is the continent in force
(
ALLwhen none is selected). - Everything in brackets is narrowing it further, always in the same order: logger, country, date, month · hour, distance, propagation, bearing, UTC hour. No brackets means nothing else is narrowing.
- Then the totals: loggings, distinct stations, distinct loggers, distinct countries, the date range covered, and the furthest catch in the set.
Distances appear in km or miles and dates in your chosen date format, both taken from Settings every time the window opens.
6.2 Every bar is a filter
One rule covers the whole window:
- Click a bar, a heatmap cell or a list row and the result list behind the window is narrowed to exactly the loggings that bar counted. The window closes, because what you asked for is on the list underneath it.
- Open Stats again and the bar you clicked is drawn in the accent colour, so you can see what the view is standing on.
- Click that highlighted bar again to clear it. Clearing keeps the window open and redraws it in place, so you can immediately try a different bar.
Filters from different charts combine. A country from one tab, a 20° bearing bucket from another and a UTC hour from a third apply together, and the scope line at the top lists all of them.
A bar with nothing in it is inert: an empty hour or an empty distance band has no loggings to show, so it takes no click — though it still has a tooltip, because "nothing was logged at 04 UTC" is an answer too.
6.3 Where the filters show on the page: the pills
Most Stats filters appear as small pills on the result page, just
under the continent buttons and above the in-page find box. Each pill names the
filter and carries a × that removes it:
Date: 05.10.2025— or a range,01.11.2025 – 30.11.2025Nov · 05 UTC— one heatmap cell (that month, that hour)Station country: FIN— the country of the transmitter, which is the country the Logs by country bars count. Not the logger's; that one is a search field, and it is namedLogger countrywherever it appears.Distance: 1000–1500 km— in your own unit, or an open-ended4000+ kmfor the last band. The band edges depend on the list you are on; see §6.7Propagation: EsBearing: 340–360°Hour: 05:00–05:59 UTC— that hour on every date in the result
The continent is the one thing that gets no pill, because the page already has a control for it: clicking a continent bar in the Stats window simply presses the matching continent button, so there is one continent filter and not two that could disagree.
You can therefore clear a Stats filter in three ways: the pill's
×, clicking the highlighted bar again, or the small
clear link in the caption under a chart. The caption's link matters when
you have drilled from a month into its days, because the highlighted month bar is no
longer drawn — and the pills are behind the window while it is open.
While the map is open the pills are behind it, so the map's own header lists them after its summary line (§7.2) — the same words, as a readout rather than as controls.
The Date: pill has one other way in: clicking a date in a
transmitter's popup on the map (§7.3) sets exactly this
filter, and the pill that appears is the same pill, clearable the same ways. There
is one date filter on the page, not a Stats one and a map one.
None of this re-runs the database search. The hit count next to the buttons goes on reporting the search total; the Stats filters narrow what is displayed from it.
6.4 Anything you can see as rows, you can see on the map
The MAP button always maps exactly the rows the list
is showing — including every Stats filter you have set. So the drill-downs
in this window are also a way of choosing what appears on the map: filter to one
day, one country, one distance band or one 20° bearing bucket, then press
MAP. Whatever you filtered by is named on the map's own
header (§7.2), so you can see from inside the
panel which of these is in force.
- If the map panel is already open when you filter from the Stats window, it redraws itself to match. You never have to close and reopen it.
- The line above the map summarises the same set: loggings, stations, loggers, and the bearing spread (lowest, highest and median).
- Marker pop-ups work as described in §7 Maps.
6.5 Tab 1 — Logs by day
A timeline of the whole result: one bar per date, oldest on the left.
- Logs / Stations / Countries. The buttons beside the heading choose what the bars count. Logs is how busy a day was; Countries is how varied it was — and a big day and a varied day are often not the same day. Stations counts distinct stations rather than loggings.
- The red line across the chart is the running total, and it is drawn in Logs mode only. Stations and countries are counted distinctly per day, so adding them up over days would count the same station again and again.
- Hover a bar for that day's four figures at once: loggings, stations, countries and loggers.
- More than 92 days in the result rolls the chart up into months — the heading then says (monthly). Station and country counts are the month's distinct ones, not the sum of its days.
- Click a day to show only that day's loggings. Click a month to filter to that month and open its days here.
Loggings with no date are in no bar.
Logs by day (yearly)
When the result spans more than a year, a second chart appears below the timeline: twelve bars, January to December, each one every year's worth of that month added together. The timeline says when something happened; this says what time of year it happens — which sixty bars in date order cannot show, because they stand the five Julys twelve bars apart and leave the comparison to your eye.
- Logs / Stations / Countries. Its own buttons, independent of the timeline's above, so the two charts can be read on different measures at once.
- Hover a bar for the same four figures as the timeline: loggings, stations, countries and loggers. Stations, countries and loggers are counted distinctly across the whole period, so a station heard in three different Julys counts once.
- Click a month and the chart opens into that month's days, still consolidated: every 22 July in the result on one bar. That is the chart that answers which days of July have been the best over the years. Use Back to the months under it to return.
- Unlike every other chart in this window, these bars do not filter the log — "every July" is not a date range. Opening a month changes this chart and nothing else; the result list behind the window does not move, and the window does not close.
- It comes and goes with the span of the result, not with the tab. Filter to a single month — by clicking a month bar on the timeline above, say — and the period is no longer over a year, so this chart steps aside until you clear that filter.
A month with no loggings keeps its place and its hover, because these twelve bars are a calendar — closing the gap would put July where June should be. February gets 29 day bars, since a span of several years may include a leap year.
6.6 Tab 2 — Logs by area
Two charts, one above the other.
Logs by country
-
The top 25 countries by number of loggings, with the number of distinct stations
beside each bar (
· 88 stn). Everything past the top 25 is rolled into an Others bar, which is a total rather than a country and therefore takes no click. - Logs / Furthest. Furthest re-ranks the same countries by the single longest catch from each, in your own distance unit. It answers a different question: not "where do I hear most" but "how far does each country reach me". Countries whose loggings carry no distance are not ranked in that mode.
- Click a country to show only its loggings — in either mode, the click filters on the country.
-
UNIDcollects loggings with no country recorded.
Logs by continent
- Loggings, stations and countries per continent.
- Clicking a continent presses the continent button behind the window, so the page has one continent filter rather than two. The window closes and the button bar shows which continent is active.
- Clicking the highlighted continent goes back to all continents and redraws the chart in place, without closing the window.
-
UNIDhere means "no continent" — it has no button on the page and so takes no click.
6.7 Tab 3 — Time & direction
Four charts on MWLIST, five on FMLIST.
Logs by UTC hour
- 24 bars, one per UTC hour, counted across every date in the result.
- Clicking one shows that hour on every date — use the heatmap below if you want one hour of one month.
- Loggings with no time are in no bar.
Heatmap: UTC hour × month
- One row per month the search covers, in season order, and 24 columns of UTC hours. Colour runs in ten steps from pale cyan (quietest) to red (busiest) — the same ramp used on Es/MUF maps — and the legend under the grid says what 100% was worth in absolute numbers.
- Logs / Countries. Switching to Countries colours each cell by how many different countries were heard in it, which is the diversity view of the same grid.
- Clicking a cell filters to that month and that hour in every year the result covers — the November row merges every November.
- Empty cells stay neutral and take no click, but they still name the month and hour on hover.
Logs by bearing
- Bars (the default) is a histogram of 18 buckets of 20° each, labelled by the degree they start at. Clicking a bucket filters to it.
- Rose is the 16-point compass version, where each wedge's area is proportional to its count. It is a summary for the eye and is hover-only — switch back to Bars to filter.
- A bearing of 0° is due north and is counted. Only loggings with no bearing at all are left out.
Logs by distance
-
Nine bands, round in your own unit — and the band width follows the
list you are on, because FM and AM are not the same distance problem:
FM DX is tropo and Sporadic-E, and nearly all of it falls inside 2000 km (1243 mi), so narrow bands are what separate one opening from another. MW and shortwave run to the far side of the world, where 500 km (311 mi) bands would give you a long row of empty bars and one spike.
Kilometres Miles FMLIST 500 km steps up to 4000+ 300 mile steps up to 2400+ MWLIST 2000 km steps up to 16000+ 1250 mile steps up to 10000+ - Clicking a band shows exactly that band — not everything nearer or further.
- Loggings with no distance are in no band, so the bars deliberately add up to less than the total.
- If you change unit in Settings, a band you picked in the other unit no longer matches any bar; the caption then offers a link to clear it.
Logs by propagation (FMLIST only)
- One bar per propagation mode as the database spells it (Es, Tropo, MS …). MWLIST has no propagation field, so the chart is not drawn there.
- Clicking a mode shows only its loggings.
- The tooltip adds the mode's average and maximum distance, so you can compare how far each mode reaches and not only how often it appears. The average covers the loggings that actually carry a distance, and the tooltip says how many those were when they are fewer than the mode's total.
6.8 Tab 4 — Top lists
Best days
- The ten best days in the result, and the buttons choose what "best" means: Logs (busiest), Countries (most varied) or Furthest (the day the DX came in). The heading changes with the ranking, so it always says which list you are looking at.
- Every row shows the date with its loggings, stations, countries and that day's furthest catch.
- Click a row to show that day's loggings. This is the same date filter the day chart sets — useful because a great DX day can be a very small bar on the timeline.
- If a date filter is already on, that day's row is shown in bold, and clicking it clears the filter.
Furthest logs
The ten longest single catches in the result: frequency, country, programme and location, distance, bearing and date.
On FMLIST, loggings recorded at 9999 km (6213 mi) or beyond are left out of every distance figure in this window. That is not a catch — it is what the feed writes when a transmitter site is unknown, and one such row otherwise sat at the top of Furthest, Furthest logs, Furthest by country and Furthest catch by day permanently, since nothing real on FM can beat it. The logging itself is untouched and still counts everywhere else: in the totals, in its country, on its day, among its station's loggings. It simply has no distance. MWLIST keeps its long distances, where 9999 km is an ordinary night's catch.
Most-logged stations
The ten stations that appear most often in the result, with the number of loggings for each.
6.9 Putting it together — worked examples
-
"Show me my best DX day, on the map."
Stats → Top lists → Furthest → click the first row (the
window closes and the list shows that day) →
MAP. -
"When does Morocco come through?"
Stats → Logs by area → click
MRC→ Stats again → Time & direction → read the UTC-hour chart, now counted over Moroccan loggings only. - "Was that a big night or a varied one?" Stats → Logs by day → switch to Countries and compare the shape with Logs.
- "One month, hour by hour." Logs by day → click a month bar (the chart opens that month's days without closing) → or the heatmap, where a single cell is one month and one hour.
- "Which dates in July have been my best over the years?" Search several years at once → Stats → Logs by day → scroll to Logs by day (yearly) → click Jul. The chart becomes 31 bars, one per date, each adding up every July in the search. Hover the tallest to see how many loggings, stations, countries and loggers it took. Switch to Countries if you want the most varied date rather than the busiest.
- "Is my Sporadic-E season starting earlier than it used to?" Search the whole log → Logs by day (yearly) → click May, then Jun, and read where in each month the bars begin to stand up. Both months are counted over every year at once, so what you are looking at is the shape of the season rather than one year's weather.
6.10 Notes and limits
- A logging missing a field is left out of that chart only. No date, no bar in the timeline; no time, no hour; no distance, no band; no bearing, no bucket. It still counts everywhere else, which is why some charts add up to less than the total on the scope line.
- On FMLIST, a distance of 9999 km (6213 mi) or more counts as no distance — it is the feed's way of saying the transmitter site is unknown, not a record catch. Such a logging is in no distance band and wins no Furthest ranking, but is otherwise counted like any other. See §6.8.
- The switches remember their position while the browser tab is open, so reopening the window keeps the view you were using. They are not saved between sessions, because they are a way of reading one result rather than a setting. The month you have opened in Logs by day (yearly) is remembered the same way — and dropped if a new search has nothing in it.
-
Settings are read every time the window opens, so a change of
distance unit or date format shows up the next time you press
STATS. - The charts are drawn from the result already in your browser — no new database query is made, so filtering here is instant even on large results.
7. Maps
Both pages have a MAP button. On
Log Station it maps the candidate transmitters; on
Log Search it maps the loggings you are looking at.
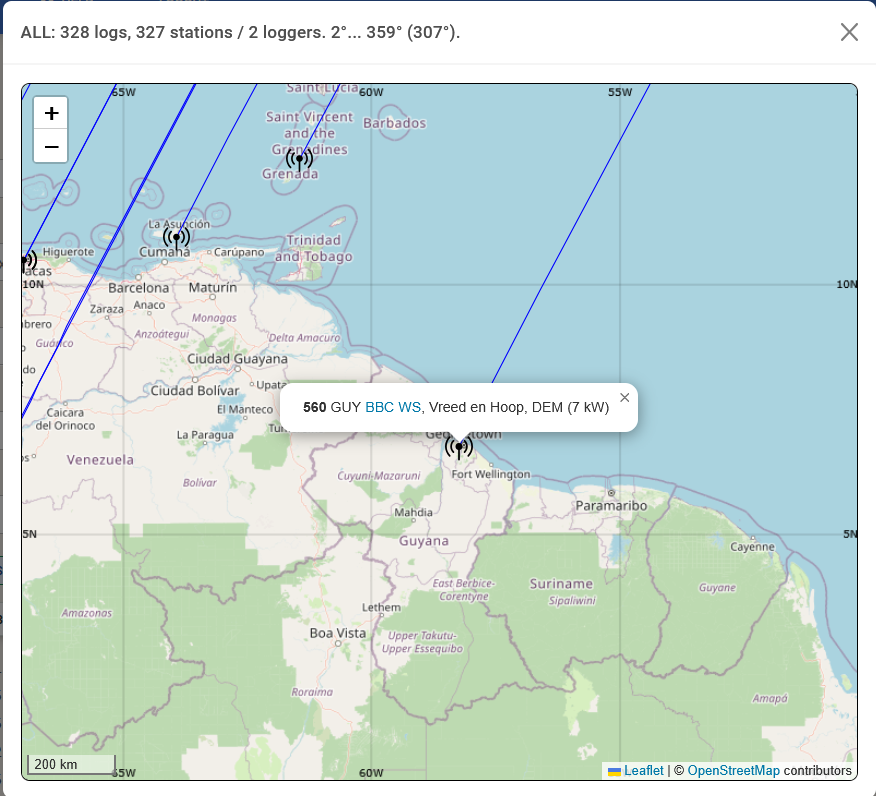
7.1 The Map Panel
- The panel can be dragged by its header to somewhere that does not cover what you want to read.
-
Close it with the
×in its corner. - It always shows exactly the rows the list is showing — every continent, credit, find and Stats filter included. Change a filter while the map is open and it redraws itself; you never have to close and reopen it. CLEAR empties it too: the markers go with the result they were drawn from, and the panel is left open and blank rather than showing a search you have just cleared.
- A scale bar and a latitude/longitude graticule are drawn over the map. Zoom runs from 2 (the whole world) to 10.
- On a narrow screen it takes the screen. Below about 768 px wide — a phone, or a window dragged small — the panel fills everything under the navigation bar instead of keeping to its usual half-width corner. A map is nothing but detail, and half of a phone screen is not enough of it to read.
- Drag the hatched corner at the bottom right to resize it. Any size from about 260 × 200 up to the window itself. The map redraws as you drag, so you can see what you are gaining.
- A panel you have dragged or resized stays where you put it, and does not go off the screen: make the window smaller and it is brought back inside the edges, shrinking if it has to — and when you make the window big again it returns to the size you chose. Narrowing the browser does not cost you the size you had.
7.2 The Line Above the Map
EU: 1,204 logs, 251 stations / 12 loggers. 12°... 348° (196°).
What is being shown, how many loggings and distinct stations it contains, how many loggers contributed, and the bearing spread — lowest, highest, and the median in brackets. If the in-page find is active it is named at the end.
The first word is the filter the map is built on:
a continent code, a logger's name, 3 loggers,
or ALL. So the continent, the Loggers menu
and the find are all accounted for in this one line.
The filters after it
Everything else narrowing the view follows it on the same line, as small outlined labels:
EU: 1,204 logs, 251 stations / 12 loggers. 12°... 348° (196°).
Listening: 01.03.2026 – 31.03.2026
Logger country: FIN
Date: 15.03.2026
They come from two places, and they are listed in that order — what you searched for first, then what has been filtered out of the result since:
| Label | Where it comes from |
|---|---|
Listening: … |
The Listening Date range the search actually covered (§4.2) — see the note below, which is not always what you typed. |
Logger country: … |
The Logger Country you searched with (§4.5) — the countries the listeners are in. Three codes, then +2 for the rest. |
| everything else | The Stats filters — the same words as the pills on the page (§6.3), because they are the same filters. |
Station country and
Logger country are two different things.
Station country: FIN is where the
transmitter is — the code you see in
90.9 FIN Radio Suomi, set from the
Logs by country bars. Logger country: FIN
is where the listener was. Both can be on at once, and then
the map shows Finns hearing Finland.
They are there because the form and the pills are behind the map. The panel covers the page, and a map of one day and a map of a whole year's search look much alike until you count the pins — so the map now says what it is standing on rather than leaving you to close it and check. It matters most after you have narrowed the view from the map itself, by clicking a date in a transmitter's popup (§7.3).
The two search labels describe the search that produced these
rows, not whatever the form says now. Change a date in the
form and the header does not move until you press
SEARCH — it would otherwise announce a search
you have not run.
What Listening: actually shows
The dates the search ran with, which are not always the ones you typed. Three rules stand between the field and the search, and the label is what comes out of all three:
| You leave or type | The search uses |
|---|---|
| both fields empty | the last 365 days, ending today. This is why an old logging can be missing from a search you thought had no dates on it — and now the header says so instead of leaving you to guess. |
an end of 2026, or 03.2026 |
the end of that period — 31 December, or 31 March — and then clamped to today, because nothing can have been logged after today. A partial end date in the current year therefore shows as today. |
a start of 2026, or 03.2026 |
the beginning of that period — 1 January, or 1 March. Start dates open the range, end dates close it. |
| both dates in full | exactly what you typed. The label repeats it back. |
A single day is written once rather than twice:
Listening: 15.03.2026, not
15.03.2026 – 15.03.2026.
It stands down while a Date: filter is
on. The two answer the same question — which dates am I
looking at — and the narrower one is the true answer, so only it is
shown. Clear the Date: filter and
Listening: comes back unchanged. This applies
to a date range from a month drill-down as much as to a
single day: the header never carries two date ranges at once.
The one date-shaped filter that does not displace it is the
heatmap cell, Nov · 05 UTC. That picks a
month of the year across every year in the result, so the
listening window is what tells you which Novembers you are
looking at — it still adds something, where a date range does not.
Nothing else — a country, a distance band, an hour — affects it
either way.
They are a readout, not controls. There is no
× on them: clear a filter with the pill
on the page, with the highlighted bar in the Stats window, or — if
you set it from the map — with the undo arrow
(§7.3). The two search labels have no pill
at all — they change when you run another search, and not before.
None of them are there when nothing is narrowing the view, and they take no line of their own when they are: they sit in the summary's own line and only wrap below it if you have set enough of them that they genuinely do not fit. The map panel is small, and a row of its height is worth more as map.
7.3 The Symbols
| Symbol | Meaning |
|---|---|
| Red teardrop pin | A receiver — your QTH, or another logger's. Click it for a popup naming the logger, which is also the way to see that one person's loggings — see just below. |
| Broadcast mast symbol | A transmitter. The dot at the centre of the arcs is the true site position. |
| Thin arcs | Great-circle paths from a receiver to the transmitters it heard. |
| Two straight rays | The edges of a bearing range you set (§7.5). |
| Concentric rings | The FMLIST distance rings (§7.4). |
Clicking a transmitter shows the frequency, the station name, and — when the view is of a single logger, so the reference QTH is unambiguous — the distance and bearing. Under that comes Heard by, the list of everyone in the result who logged it — see just below. The station name is a link. Clicking it opens Google Maps in a new tab, in satellite view and zoomed right in on the transmitter's own coordinates — close enough to see the mast and how its antennas are arranged. It is the quickest way to check that a site really is what the database says it is, and on the search page it works on other people's loggings as well as your own.
It is a link only where the database has coordinates for that transmitter. Without them the name appears in bold and does nothing — there is no position to centre a satellite view on.
Where several stations share one mast, the pop-up lists them all under
the site name, with the number of stations and loggings at that site.
This is common on MW, where a single mast may carry a dozen entries.
Each of them carries its own Heard by list, folded
away behind a ▸ 3 loggers control, so that a
big FM site opens as its list of frequencies rather than as several
hundred names.
Who heard this transmitter
Under the station line, a transmitter's popup lists every logger in the result who heard it — one line each: their LoggerID, then their dates and times, newest first. Times are UTC. Loggers are listed alphabetically, in the same order and under the same names as the Loggers menu (§5.5), because clicking one is what picks that menu entry.
Both halves of a row are clickable, and they narrow different things. The LoggerID narrows to who; each date narrows to when. They can be used one after the other, and that is what the undo arrow now has two steps for.
| The popup reads | What it is |
|---|---|
90.9 FIN Radio Suomi, Vaasa, OSTRO (60 kW) |
The station itself, exactly as before — and the programme name is still the Google Maps link. |
Heard by · 3 loggers (UTC) |
How many people in this result logged it. The count is left off when there is only one. |
OH6BG 12.03.2026 05:00 |
One logger, and when. OH6BG is a link, and so is 12.03.2026. The time is not. |
JKP 15.03.2026 06:42, 14.03.2026 07:10 |
Someone who heard it twice. Newest first, and each date is its own link. |
Each LoggerID is a link. Click it and the whole result narrows to that person, exactly as clicking their receiver pin would: the list, the map and the summary line together. It works the same way too — it ticks them in the Loggers menu rather than applying a filter of its own, so you can widen it again from the control you already know.
Once the map is one person's, the names stop being links — on their map every transmitter was heard by them and nobody else, so there is no one to switch to. The dates go on working. The name links come back as soon as the map holds more than one logger again, which the undo arrow is the quickest way to arrange.
Each date is a link too, and it filters the page to that one day. Only the date — the time beside it is plain text, because the filter behind the link is a day rather than a minute.
What you get depends on what the map was already showing, because the click applies the date and changes nothing else:
| Click a date while the map shows | and you get |
|---|---|
| everyone, or one continent | the map for that day — everything everyone logged on it, the continent still applied if you had one. |
| one logger | only what that person heard on that day. The date lands on top of the logger already selected. |
It is the same filter the Stats window's day bars set, not a second
one: a Date: pill appears under the continent
buttons (§6.3), the Stats window draws that day as
the one the view is standing on, and you can clear it from the pill,
from the chart, or with the undo arrow.
A date stops being a link once it is the filter — on a map already showing one day, every logging in every popup is on that day, so there is nothing left for the click to narrow. If you have drilled to a whole month from the Stats window, the individual dates are still links, and clicking one takes you from the month to the day.
Walking from one logger to the next
This is what the list is for: a transmitter you find interesting names everyone who has heard it, and you can look at each of their maps in turn without losing your place.
- Click the transmitter pin. Its popup names the loggers who heard it.
- Click a LoggerID. The map redraws as that person's loggings — their QTH, everything they heard, their own great-circle paths.
- Click the undo arrow (↺) in the map's title bar. It puts back whichever loggers were showing before and reopens the same transmitter's popup, with the same station unfolded.
- Click the next name. Repeat for as long as the list lasts.
The loop runs as long as you like, and it cannot get lost.
How far back the arrow goes
One click is one step, and there are never more than two of them. That is not a limit imposed on you — it is simply how far in you can get, because a link is only ever offered while clicking it would change something:
- Click a LoggerID. That is step one. On the map you land on there are no more names to follow, so the only link left is a date.
- Click a date. That is step two. Now the map holds one logger and one day, and it offers neither kind of link.
So two clicks of the arrow always bring you back to where you started, and the arrow disappears when it has. You can take the two steps in either order — a date first and then a logger works the same way, and undoes in the reverse order you took them. Hover the arrow and it says what the next click will put back.
The arrow drops a step you have already undone by hand. Change the
Loggers menu yourself and the logger step goes; clear the
Date: pill, or pick a different day in the Stats
window, and the date step goes — the other one stays, because it is
still a true way back. Press CLEAR or run a new
search and the arrow goes altogether, since the result it pointed into
no longer exists.
| A shared mast reads | What it is |
|---|---|
Vaasa, OSTRO |
The site — one pin for the whole mast, however many services stand on it. |
7 stations · 41 loggings |
What is transmitted from there, and how much of your result came from it. |
89.4 FIN Yle Puhe · 6 loggings ▸ 3 loggers |
One station on the mast. ▸ 3 loggers
opens its own Heard by list — the same list as
above, carrying the same links on the LoggerIDs and on the
dates; the arrow turns to ▾ and clicking
again folds it away. Open as many as you like at once.
|
The folding is what keeps a big FM site usable. A tower carrying thirty services would otherwise open as several hundred names, and the list of frequencies — which is what you went to the mast to read — would be buried in it. Folded, you see the frequencies first and ask for the names only where you want them. A popup that outgrows the map scrolls inside itself rather than covering it.
A logger who heard the same station many times is shown with their
eight most recent loggings, then +12 more for the
rest — the number is never hidden, only the timestamps behind it. The
per-station · 6 loggings count on a shared mast
counts all of them, from everybody.
Jumping to one logger from their pin
Clicking a red receiver pin opens a popup naming the logger who was listening there. Their name is a link. Click it and the whole result narrows to that person's loggings — the list, the map and the summary line together.
It is not a separate filter: it ticks them in the Loggers menu (§5.5), which updates to show who is on screen. You can widen it again from there exactly as if you had picked them by hand.
| The popup reads | The link is |
|---|---|
Arie JW Hermans, outside - Almodovar Del Rio, Andalucia, Spain (E) |
Arie JW Hermans |
OH6BG (FIN) |
OH6BG |
Only the person is the link. Everything from the first comma on is where they were listening, not who they are, and the country code in brackets is never part of it. As with the transmitter popups, the name is plain text rather than a link once the map is already that one person's — there is nothing left to narrow it to.
An undo arrow (↺) then appears in the map's title bar. It puts back whichever loggers were showing before you clicked — so if you already had two picked, you get those two back, not everybody. (Followed from a transmitter popup instead, it also reopens that popup — see above.) It goes away once there is nothing left for it to undo — see How far back the arrow goes for the two steps it can hold and what takes them away.
7.4 The FMLIST Distance Rings
On FMLIST, when the result is a single logger's, four rings are drawn around their QTH, and each one carries its distance printed on it, in that ring's own colour, where it crosses the meridian below the receiver (above it, if the receiver is in the southern hemisphere). You no longer have to remember which ring is which.
The rings follow the distance unit you chose in Settings — and they are drawn at round numbers in that unit, rather than at converted kilometre figures. A mile reader has no use for a ring labelled 621 mi:
| Ring | If you use km | If you use miles | What it marks |
|---|---|---|---|
| 1st, red | 1000 km | 600 mi | The usual single-hop Sporadic-E range |
| 2nd, green | 1500 km | 1000 mi | |
| 3rd, blue | 2500 km | 1500 mi | Beyond single-hop; double-hop territory |
| 4th, red | 3500 km | 2200 mi |
The two sets cover almost exactly the same stretch of map — 2200 mi is 3541 km, against the 3500 km of the outermost metric ring — so an opening looks the same shape whichever unit you read it in. Change the unit with the map open and the rings change size, not merely caption, and they do it immediately without redrawing the rest of the map.
They give an immediate read on whether an opening was ordinary or exceptional. They are not drawn for a multi-logger result, because a ring around one of several receivers would be meaningless.
7.5 Bearing Lines
Set a bearing range in the search filters and two rays are drawn from the receiver along its edges. They stay full length as you pan and zoom — they are redrawn to reach the edge of whatever view you are in, so they never stop short in the middle of the ocean.
7.6 Great Circles, and When They Are Left Out
Every receiver–transmitter pair gets an arc, drawn as a true great circle rather than a straight line on a flat map. Above 4000 distinct pairs the lines are dropped and only the markers are drawn: at that density the lines are a solid wash that hides the map underneath. Narrow the result — by continent, by logger, or from the Stats window — and they come back.
7.7 Across the Dateline
A result that straddles 180° is drawn as one continuous view rather than split into two clumps at opposite edges of the map. A receiver in the Pacific hearing Japan and North America gets a single centred picture with its lines intact. For any result that does not cross the dateline nothing changes at all.
7.8 Big Maps Fill In Rather Than Appearing at Once
A large result puts a great many pins on the map — ten thousand transmitter sites is an ordinary afternoon's work for a wide search — and placing that many is not instant. Rather than hold everything back until the last one is ready, DX Log draws the map first and then fills it:
- The map appears already framed on your result, empty.
- The pins then arrive in a handful of waves, the receivers first, so you can see where you were listening from straight away.
- The first pins are there within a fraction of a second. Ten thousand sites take roughly three seconds to finish.
A map that is still filling is not a map that is stuck. The page stays usable throughout — you can scroll the list, pan and zoom, and open a bubble on a pin that has already landed.
Change a filter while it is still filling and the fill simply stops and the new one begins, so you never see two results' pins mixed together. A modest result — up to a few hundred sites, which is most of them — has nothing to spread out and appears in one go, exactly as before.
This is why a very large result now takes a moment or two longer to finish than it once did, while feeling considerably quicker: the same work is spread across frames so the browser can keep drawing, instead of being done in one block with the page frozen until it ends.
8. Editing & Deleting Logs
8.1 Which Logs You Can Edit
You can edit your own logs only — those whose LoggerID is one of the credits in your MWLIST/FMLIST profile. Those rows carry a pen icon at the end; other people's rows do not, and there is no way to change them.
8.2 The Edit Window
- Click the pen icon at the end of the desired row.
- The Edit Log modal opens (with fields similar to the new logging form).
- Update any fields that need correction or additional detail.
- You may change the Credit/QTH if the log was originally assigned to the wrong listening location.
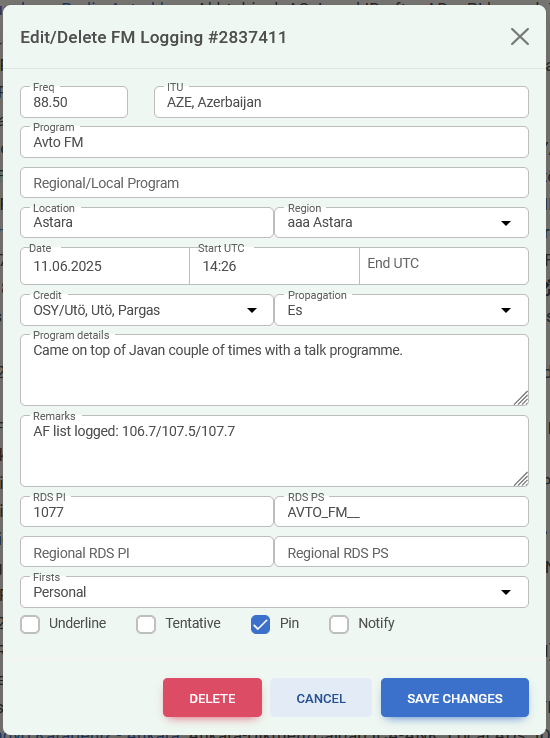
The window can be dragged by its header, and the page behind it stays live — you can read the list underneath while it is open. Esc closes it.
The read-only "FYI" fields and their unlock toggles work exactly as they do when logging — see §3.10. So does Notify (§3.11): altering frequency, program, regional/local program, location or RDS PI arms it again for editor awareness.
Date and Start UTC cannot be left empty; saving without them is refused with a message. A date that is not a valid calendar date is refused rather than guessed at, because a wrong date silently written is worse than a save that did not happen.
After a successful save, the list scrolls back to the row you edited and highlights it, so you do not lose your place in a long result.
8.3 Deleting
The edit window also offers Delete. It asks for confirmation in a second dialog, and then the logging is removed from the MWLIST/FMLIST database.
9. Saving Your Results
Two buttons appear below a search result on the Log Search page: Save as Excel and Save as Word. Both write exactly the rows on screen — after the continent bar, the Loggers menu, the in-page find and every Stats filter. Filter first, then export.
Files are named DX_Log_<today>.xlsx and
DX_Log_<today>.docx. If nothing is showing,
the export refuses rather than handing you a file of column titles.
9.1 Save as Excel — the Raw Data
One row per logging, meant for sorting, pivoting and
further analysis — 24 columns on MWLIST, 26 on FMLIST,
which adds PI and PS. Dates are written in ISO form
(YYYY-MM-DD) so a spreadsheet reads them as dates
whatever your display setting is.
Every numeric column really is numeric — Frequency, Power, Distance, Bearing and the three 1/0 flags are numbers rather than text, so they sort, sum and filter as numbers — 999 before 1521, not after it. Frequency and Power are aligned to the left of their cells, because a frequency is a label that happens to be spelled with digits; Distance and Bearing keep the right alignment a quantity should have. A frequency shows two decimals on FMLIST and none on MWLIST unless it is an offset one, and a power shows only the decimals it was given. Because the cells hold numbers, the decimal separator is the one your own Excel uses — a comma if that is what your regional settings say. Nothing in the file can override that; the full value is stored either way.
| Columns |
|---|
| Frequency, Date, Start UTC, End UTC |
| Country, Continent, Station, Location, Region |
| Comment — your Program details and Remarks merged into one field, with the logging program’s own marker removed (it has the Software column instead) |
| First — spelled out as Personal, Country, Continent or World, because it is a category rather than a flag |
| Underline, Tentative, Pinned — 1 or 0 as numbers, so you can sum a column to count how many loggings carry the flag, or filter on it without matching text |
| Power, kW — empty where the power is unknown, rather than a zero that looks like a measurement |
| Distance, km or Distance, mi — the column is headed with your distance unit (§2) and holds that unit’s figure, so it agrees with what the result list shows you. Bearing sits beside it, and the two stand or fall together: where there is no distance, both cells are empty — a bearing computed from a transmitter position nobody knows is a number with nothing behind it. On FMLIST that includes the feed’s 9999 km “site unknown” placeholder, which the statistics ignore for the same reason (§6). |
| PropMode |
| PI, PS — FMLIST only. The RDS codes as logged, straight after PropMode. Empty where the logging has none, and absent altogether on MWLIST: RDS is an FM subcarrier, so MW and shortwave have nothing to put there. |
| LoggerCountry, LoggerID, LoggerName, LoggerQTH, LoggingDate |
| Software — the logging program that filed the logging, named in full (see §5.7); empty for a logging typed in by hand |
The header row is frozen and filtered: it stays in view as you scroll, and every column carries a dropdown, so you can narrow the sheet to one country, one propagation mode or one logging program without setting a filter up yourself.
9.2 Save as Word — the Readable Report
The Word file is consolidated: it is written the way a DX report is written, not the way a database stores one.
- One row per station per frequency. Ten loggings of one station on one channel become one line. The frequency is part of the grouping, so a station heard on two frequencies stays two lines.
- Every remark is merged into that line, separated by semicolons, each carrying its own date and credit. Identical entries are written once.
-
Dates are shortened for the current year —
5.10.rather than5.10.2025— and given in full for earlier ones. -
The page's own formatting is kept: the
+in front of a country first and its colour, the bold underline of a highlighted logging, the italics of a tentative one. - Tentative is marked where it matters. A line that is entirely tentative says so once, in front of the station name. A line mixing confirmed and uncertain receptions marks the uncertain entries individually, because there the marker is the only thing telling them apart.
- Sorted by frequency, then by earliest time, then by station.
Two unidentified stations on the same frequency are never merged — with no name and no station id there is nothing to say they are the same station.
10. Favorites
A favorite is a saved filter setup. If you run the same search every morning — your own credit, one band, last login, pinned only — save it once and recall it with two clicks.
10.1 What a Favorite Stores
Every filter field on the page: text boxes, number ranges, dates,
dropdowns, multi-selects and checkboxes. It does not store
results — recalling a favorite fills in the form; you still press
SEARCH.
Restoring clears the form first and then applies the saved values, so a favorite always defines the whole setup. You never inherit a stray filter from the search before it.
10.2 Saving
- Set the filters the way you want them.
- Open the ★ Favorites menu in the navigation bar.
- Choose Save as favorite… at the bottom.
- Accept the offered name (Favorite 1, Favorite 2…) or type your own, up to 40 characters, and press Save or Enter.
If the name is already taken, the button changes to Overwrite and says so — that is how you update a favorite after adjusting it.
10.3 Using, Renaming, Reordering, Deleting
- Apply — click the favorite's name.
- Rename — the pen icon. A name already in use is refused here rather than offered as an overwrite, since renaming onto an existing name would silently destroy the other favorite.
- Reorder — drag a row up or down the menu. Put the one you use most at the top.
- Delete — the trash icon, with a confirmation.
10.4 Scope and Limits
- Four separate sets. Log Station and Log Search each have their own, and MWLIST and FMLIST each have their own — so an FM search favorite never turns up in an AM logging menu.
- Fifteen per set. At capacity the dialog says so and asks you to overwrite or delete one.
- Stored in this browser only. Favorites are not saved on the server and do not follow you to another computer, another browser, or a private window. Clearing your browser's site data removes them.
- They survive a Settings change. Dates are stored in a neutral form, so switching between ISO, EU and US formats does not disturb a saved favorite.
- A saved value that no longer exists — a credit that has been removed, say — is skipped quietly; the rest of the favorite still applies.
11. Reference
11.1 Keyboard Shortcuts
| Key | Where | What it does |
|---|---|---|
| Enter | Either page | Runs the search. Not in a textarea, on a button, or while a dialog is open. |
| Enter | In the find box | Applies the in-page find (does not re-run the search). |
| Esc | In the find box | Clears the find. |
| Ctrl+F / ⌘+F | Log Search, once a result exists | Scrolls to the top, focuses the find box and selects what is in it. |
| Esc | Any dialog | Closes it — the Stats window, the log window, Settings, About. |
| ↑ ↓ | Log Station | Steps the frequency up/down by the chosen step, snapping to the channel grid. |
| Numpad + − | Log Station | The same. |
| Numpad 8 2 | Log Station, NumLock off | The same. |
| Double-click | Any Max/End field | Copies the Min/Start value into it (§4.7). |
11.2 Band Ranges
MWLIST
| LW | 148–284 kHz |
| MW | 525–1710 kHz |
| SW | 2–30 MHz |
| 120 mb | 2300–2500 kHz |
| 90 mb | 3200–3400 kHz |
| 75 mb | 3900–4050 kHz |
| 60 mb | 4700–5150 kHz |
| 49 mb | 5700–6400 kHz |
| 41 mb | 7200–7600 kHz |
| 31 mb | 9300–10000 kHz |
| 25 mb | 11400–12200 kHz |
| 22 mb | 13500–13900 kHz |
| 19 mb | 15000–15900 kHz |
| 16 mb | 17300–18000 kHz |
| 15 mb | 18900–19100 kHz |
| 13 mb | 21450–21900 kHz |
| 11 mb | 25600–26100 kHz |
FMLIST
| FM CCIR | 87–108 MHz |
| FM OIRT | 65.84–74 MHz |
| FM Japan | 76–95 MHz |
| FM China Low | 78–87.5 MHz |
| TV VHF Low | 54–87 MHz |
| TV VHF High | 174–216 MHz |
| TV UHF | 470–806 MHz |
11.3 Steps, Modes and Categories
Frequency steps
AM: 1 · 5 · 9 · 10 kHz (default 9)
FM: 0.03 · 0.05 · 0.1 · 0.2 · 1 MHz (default 0.1)
First categories
Personal ✔ · Country + · Continent # · World 🌐
Propagation modes (FMLIST)
Es · Tropo · Meteor Scatter (MS) · Aurora (Au) · AuroraEs (AuEs) · F2 · FAI · TEP
Range ceilings
Distance 20 000 km (12 427 mi) · Power 5000 kW · Bearing 0–360° · Frequency 0–30 000 kHz (AM), 30.01–806 MHz (FM)
11.4 Continent Buttons
MWLIST
ALL · EU Europe · BI British Isles · IB Iberia · ME Middle East · AF Africa · AS Asia · OC Oceania · NA North America · CA Central America · SA South America · AN Antarctica
FMLIST
ALL · NRD Nordic · BLT Baltics · CEU Central EU · EEU Eastern EU · WEU Western EU w/o France · FRA France & Monaco · BI British Isles · IB Iberia · MED Italy and SMR/CVA/MLT · BKN Balkans · RU Russia · MAG Maghreb · ME Middle East · AF Africa w/o Maghreb & ME · AS Asia w/o ME · NOA North Atlantic · NA North America · CA Caribbean
Only the areas your current result contains get a button.
11.5 What DX Log Stores in Your Browser
Nothing here is sent anywhere except your login token, which is what authenticates your searches and log writes.
| What | Why |
|---|---|
| Login token, your credits, current and previous login times | Signing in, the Credit menus, and the "Logs since" options. |
| Environment (MWLIST / FMLIST) | Which database you are working in. |
| Date format, distance unit | Settings (§2). |
| Favorites | Saved filter setups (§10). |
| Last-used credit and propagation, frequency step per band | So the logging form opens the way you left it. |
| Pin checkbox state, funnel state | Sticky filters (§3.4, §4.6). |
| The date of your last logging, and whether you have settled it for the current UTC day | Pre-filling the next one, and knowing when to ask about it (§3.9). Cleared when the tab closes. |
| Consent | So the prompt is not shown again. |
Clearing your browser's site data signs you out and removes all of it, favorites included.
12. Tips, Notes & Common Pitfalls
- Pick the right environment first (MWLIST vs FMLIST). It controls which database you search and which fields (for example, RDS PI) apply. The navbar colour tells you which one you are in — blue AM, green FM.
- Verify your QTH selection before logging. Changing Credit/Logger later is possible, but avoidable.
-
Use partial text to find stations quickly in Station > Program
(for example,
Nacional,BBC,WBZ). - Frequency steps matter: choose steps matching the region/bandplan to avoid skipping valid channels.
- Tentative is appropriate if you have content but lack a full ID; add remarks to explain uncertainty.
- Use First and Underline thoughtfully — they are useful for research, awards, and reporting.
- Results seem to "disappear"? Three sticky controls are the usual culprits, and all three survive a restart: the Pin checkbox on the search page, the funnel on the Log Station page, and a continent button or Stats filter still in force. The status line and the pills always say what is narrowing the view — read them before concluding data is missing.
- No filters? Expect your last 12 months only. Add filters to see more, especially older dates or other users.
- A result far smaller than the total? Look at the summary line. "1,204 of 233,330" with no filters set means the search was too large to fetch whole and was cut back to a complete date range (§4.10) — narrow it rather than trusting the totals.
- Don't reload to fix something. A reload discards a half-typed logging and a filled-in search form. Settings changes need no reload; neither does anything else in the app.
- Filter before you export. Both exports write exactly what is on screen, so the in-page find and the Stats window are the fastest way to produce a report of precisely one opening.
13. Quick Summary: Create a New Log
Account active → QTH created → Environment selected (MWLIST/FMLIST) → Correct Credit selected → Station searched → Station selected → Log submitted.